All published articles of this journal are available on ScienceDirect.

Explore Indonesian Spatial Patterns: Poor House Sanitation and Critical Environmental Disease in East Kalimantan
Authors Info & Affiliations
Abstract
Objective
Community-Led Total Sanitation, along with its contained 5 pillars, impacts on the fundamentals of status environmental health. This study aims to determine the spatial distribution pattern with sanitation facilities. This research aimed to analyze the distribution of houses with low economic priority in terms of topografi and their occupants' health conditions, focusing on critical environmental-based diseases, particularly stunting.
Methods
In order to improve sanitation facilities in terms of the community-based total sanitation pillar, this program was utilized as the stimulant recipient in this study, which had a population of 45 homes with special attention categories. Total sampling was employed to establish the research sample. Average Nearest Neighbor (ANN) and one-way analysis of variance (ANOVA) were used to examine the gathered data.
Results
As a result, the distribution pattern of the houses by looking at the poor environmental health condition, is categorized as clustered. The topography is hilly, with poor access to clean water, and there is no difference in the physical condition of the houses.
Conclusion
The pattern of distribution of houses with low economy is obtained in groups in areas that do not have access to adequate clean water. Diseases that exist in these community groups include diarrhea, tuberculosis, ISPA, and stunting.
1. INTRODUCTION
Household sanitation is crucial for health, disease prevention, and national development [1]. More than 2.5 billion people worldwide lack access to better sanitation services [2]. 673 million people conduct open defecation, and over 3.6 billion people lack access to properly managed sanitation services [3].
Unhealthy home conditions can trigger environment-based diseases, risk factors for stunting [4]. They as detected in the regions with poor health facilities and limited socioeconomic indicators [5]. Groups of regions with low economic levels have a greater risk for health problems [6] and the home environment affects health problems [7].
Indonesia is composed of a group of islands and archipelagos between the seas. The natural conditions of Indonesia are composed of 16,056 5.8 million km2 of islands and sea, including the Exclusive Economic Zone (ZEE), an area of approximately 2.95 million km2, and the territorial sea of about 0.3 million km2 of Indonesia, around 2.55 million km2. These conditions make Indonesia categorized as a maritime country and called an archipelagic country. Indonesia has five major islands: Sumatra Island, Kalimantan Island, Sulawesi Island, and Java Island [8].
Kalimantan Island comprises five provinces, including South, East, West, North, and Central Kalimantan. East Kalimantan consists of 2 cities, Samarinda and Balikpapan. The provincial capital of East Kalimantan is Samarinda. The geography in the Samarinda region is undulating, ranging from gently sloping to steep., with elevations ranging from 0-1,000 meters above sea level (asl) with a slope of 0-40%. The physiographical condition of East Kalimantan Province is dominated by slope or peak sub-districts. Slope or peak sub-districts are the sub-districts where most of the area is on the top of mountains or between peaks and valleys. This condition causes people to have limited access to clean water [8].
Community-Led Total Sanitation (CLTS), also known as CLTS, is a government program designed to support efforts to promote a clean and healthy way of life, stop the spread of diseases that are caused by the environment, build community capacity, and carry out government commitments to increase access to drinking water and basic sanitation. The Community-Led Total Sanitation Regulation, Number 3 of 2014, issued by the Minister of Health of the Republic of Indonesia, serves as the foundation for sanitation activities, which includes Stopping Open Defecation, Washing Hands with Soap, the Management of Household Drinking Water and Food, the Management of Household Waste and the Management of Household Liquid Waste [9].
The difficulty in accessing clean water and the poor sanitation trigger the emergence of environment-based diseases, such as chronic diarrhea and stunting. A house is an essential basic need to support human life. A house is not merely a shelter but also a place to rest, gather with family and do various other activities. Therefore, homeowners must be able to provide a home environment that can support the health of the occupants. The condition of the house's physical environment also influences the occurrence of some diseases, such as pneumonia and tuberculosis [10]. Houses with total sanitation can be a medium for developing disease agents, especially infectious diseases [11].
The physical condition of the house influences the health status of its occupants. The condition of the house floor that does not comply with the health standards can increase the risk of coughing and shortness of breath [12], [13]. The ventilation area of the house influences the occurrence of URTI, especially in toddlers [14, 15]. Home ventilation that does not meet the health requirements may also increase the risk of pulmonary tuberculosis [15]. To make it easier for the public to know the criteria for a healthy house, the government has set standard components for housing and its environment that can prevent the occurrence of diseases to the house occupants.
The availability of comfortable housing that supports community survival is one of the objectives of the Sustainable Development Goals (SDGs) [16]. The realization of a healthy house for a family can be influenced by the financial ability of the homeowner as well as his knowledge regarding healthy houses [17]. People with a middle-lower income find it challenging to access decent housing, especially if their knowledge regarding healthy houses is very limited [18]. Thus, more effort must be putinto building houses that meet health requirements.
Based on the data from the Central Statistics Agency in 2020, one out of ten households in Indonesia still lives in a slum house. Moreover, it shows that some people still struggle to access housing that meets health standards. The percentage of uninhabitable houses in urban areas is still relatively high compared to rural areas [19]. Data for the last five years show that the availability of healthy houses in East Kalimantan is still around 60-80%, including in Samarinda City [20]. Furthermore, this is also evidenced by the fact that many uninhabitable houses remain in several areas of Samarinda City.
In arranging policies related to strategies to increase the number of healthy houses, one thing that must be accomplished is to analyze the distribution of houses that are still categorized as unhealthy [21]. The goal is to implement the stimulus program to make healthy houses effective and suitable for the target. Using a spatial approach in analyzing the distribution of unhealthy-categorized houses may become the proper solution, such as using Average Nearest Neighbor (ANN) in analyzing the distribution patterns of settlements in an area [22]. It is also necessary to conduct a study on the variability of unhealthy-categorized house distribution. Thus the degree of difference in the condition of the houses in each region can be indicated.
Information related to the distribution pattern of unhealthy houses can assist the local government in optimizing the programs to improve the public health status [23]. Moreover, the existence of information related to the distribution pattern of healthy and unhealthy houses will make it easier for the government to implement programs for the targeted community. Thus, the program will run more effectively. Therefore, this study aims to determine the spatial pattern of the unhealthy-categorized house distribution using the Average Nearest Neighbor approach. In addition, this study also aims to analyze differences in the physical condition of the houses that affect the health of the occupants in the Samarinda Ulu area.
2. METHODS
This study applied a quantitative analytic observational design with a cross-sectional approach supported by a Geographic Information System. Based on the Samarinda City Health Office data, the research population was categorized as recipients of the community-based total sanitation program subsidy from the Ministry of Health of the Republic of Indonesia located in Samarinda Ulu District. A total sampling method was used to determine the research sample and the entire population was used as the research sample. There 45 houses were selected as the study samples, originating from the sub-districts of Sidodadi, Dadimulya, and Bukit Pinang. This sample selection was taken based on data from homes that have cases of environment-based critical illnesses, such as tuberculosis, diarrhea, and stunting with low economic status.
The components of the house measured to determine physical environmental conditions in the healthy house category included the ceilings, walls, floors, bedroom windows, living room windows, ventilation, kitchen smoke holes, lighting, and humidity. Lighting is measured with a Lux meter Merk Extech LT 300, and humidity is measured with Hygrometer. It included the availability of sanitation facilities such as restrooms, hand washing facilities, drinking water and food management, garbage management, and wastewater disposal facilities. In measuring the house's physical condition, standardized tools, and observation sheets were used, and an assessment was conducted using a scale of 0-100. Data on the house coordinates were collected by using Garmin GPS (Table 1).
The collected data were analyzed in two ways: spatial analysis using ArcMap 10.3 and statistical analysis using SPSS version 19.0. The analytical method used to determine the spatial pattern of the unhealthy-categorized house distribution was the Average Nearest Neighbor (ANN) approach. In addition, the one-way Analysis of Variance (ANOVA) was also conducted to determine differences in the physical condition of the houses that affect the health of the occupants in the Samarinda Ulu area.
The ANN analysis results consist of clustered, random, and dispersed distribution patterns. The distribution pattern is clustered if the z-score value is less than -1.65. The distribution pattern is random if the z-score is between -1.65 to 1.65. The distribution pattern is dispersed or spread [24] if the z-score value exceeds 1.65 (18). The Ho is approved for the one-way ANOVA test results if the F table value > (is higher than) the F count value. It signifies no variation in the dwelling condition value among the three sub-districts that serve as the study's samples. However, if the F table value < (is more minor than) the F count value, then the Ho is rejected. It means that there are differences in the value of the house condition in the three sub-districts that become the samples of this study. In addition, the decision-making of the one-way ANOVA test can be seen from the sig. If the p-value is more than 0.05, then the Ho is accepted. Whereas if the p-value is less than 0.05, then the Ho is rejected [25].
| Descriptive Information | n | Percentage (%) |
|---|---|---|
| House Category | - | - |
| Good | 1 | 2.2 |
| Enough | 20 | 43.5 |
| Not Good Enough | 21 | 45.7 |
| Bad | 4 | 8.7 |
| Ventilation | - | - |
| >10% of the floor area | 25 | 54.3 |
| <10% of the floor area | 21 | 45.7 |
| Lighting | - | - |
| 60 – 120 lux | 9 | 19.6 |
| <60 lux | 37 | 80.4 |
| Humidity | - | - |
| 40-60% Rh | 17 | 37 |
| >40-60% Rh | 29 | 63 |
| Latrine Condition | - | - |
| Qualified | 35 | 76.1 |
| Unqualified | 11 | 23.9 |
| Hand Washing Facility | - | - |
| Qualified | 20 | 43.4 |
| Unqualified | 26 | 56.6 |
| Clean Water | - | - |
| Qualified | 43 | 93.5 |
| Unqualified | 3 | 6.6 |
| Garbage Management Facility | - | - |
| Qualified | 5 | 10.9 |
| Unqualified | 41 | 89.1 |
| Wastewater Sewer | - | - |
| Qualified | 30 | 65.2 |
| Unqualified | 16 | 34.8 |
3. RESULTS AND DISCUSSION
Forty-six respondents or houses that received the study's funding for the community-based total sanitation program with sanitation problems and economically disadvantaged families in the majority (45.7%) were in the unfavorable category or not good enough.
Latrines, hand washing with soap, drinking water, household clean water management, garbage manage- ment, and domestic liquid waste management are the five pillars that make up community-based complete sanitation. Based on the identification results, it was found that there were unqualified latrines, which accounted for about 23.9%. 97.8% of the hand washing facilities were unqualified because no soap was found. The household waste management showed the results of 89.1% unqualified.
Table 2 demonstrates the output of the one-way ANOVA test regarding the assessment of the house condition categorized as not fulfilling the qualified sanitation requirement in the Samarinda Ulu area. There were 45 houses selected as the research samples, comprising 15 houses in the Sidodadi Sub-district, 15 in the Dadimulya Sub-district, and 15 in the Bukit Pinang Sub-district. The physical condition of the houses was weighted on a scale of 0 – 100, with the average value of the house condition obtained was 53.87 in Sidodadi Sub-district, 59.20 in Dadimulya Sub-district and 56.00 in Bukit Pinang Sub-district. Based on the SPSS output, the value of df1 was 2, and the value of df2 was 42. Thus, the value of the F table was 3.220. Therefore, the value of the F table is more than the value of the Fcount (3.220 > 0.644). Ho has therefore gained acceptance. Thus, it can be said that there is no difference between the three sub-districts in terms of the worth of the state of the houses, which become the samples of this study. Likewise, the significance value shows the same result with sig. > 0.05; thus, the Ho is accepted.
| Sub-district | N | Mean | Std. Deviation | F | Sig |
|---|---|---|---|---|---|
| Sidodadi | 15 | 53,87 | 10,993 | 0,445 | 0,644 |
| Dadimulya | 15 | 59,20 | 16,575 | ||
| Bukit Pinang | 16 | 56,00 | 18,268 | ||
| Total | 45 | 56,36 | 15,394 |
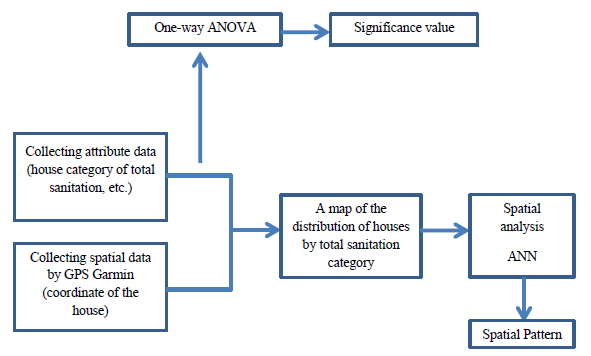
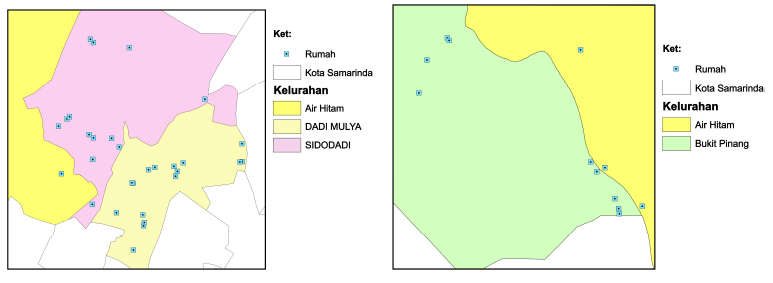
Fig. (1) describes the distribution of the houses that do not fulfill the qualified sanitation requirements in the Dadi Mulya, Sidodadi, and Bukit Pinang Sub-districts. On this map are 46 houses categorized as not fulfilling the qualified sanitation in Dadi Mulya, Sidodadi and Bukit Pinang Sub-districts. Moreover, there are several houses bordering the Air Hitam Sub-district.
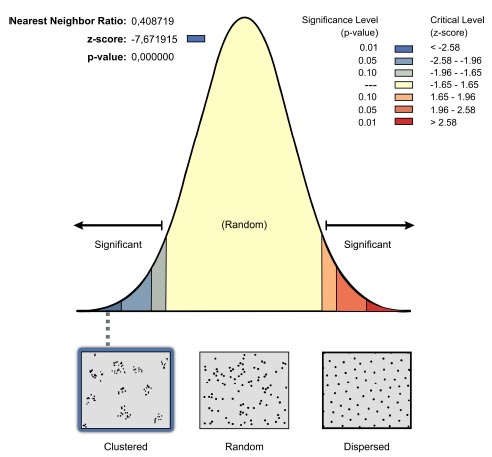
Fig. (2) explains the results of the Average Nearest Neighbor analysis, with a z-score value of -7.671915, smaller than -1.65. Thus, the distribution pattern of the houses categorized as not fulfilling the qualified sanitation requirements in the Samarinda Ulu area is clustered. In Fig. (3), it can be seen that the graph shows the results of the ANN analysis as clustered, with a significance value of 0.01 (the blue one). This indicates that the location of the houses that do not meet the qualified sanitation tend to be clustered in certain areas.
The use of ANN in determining the distribution pattern of housing/ settlements has been widely known and applied as implemented in the word [26]. The distribution pattern of houses in clustered form shows that the houses, the studied objects, are located in areas close to each other or congregate in certain areas. Topographical factors and the accessibility of an area can also affect the occurrence of residential clusters [27]. For example, the type of settlement that usually forms clusters in a specific location is slums [28].
Based on the five basic pillars, this study seeks to identify the spatial distribution of the households with subsidized sanitation services of CLTS by using the Average Nearest Neighbor approach and to analyze differences in the physical condition of the houses that affect the health of the occupants in the Samarinda Ulu area. Houses categorized as not fulfilling the qualified sanitation are mostly in slums [29]. The people who live in slums are more susceptible to diseases. The reason is an unhealthy environment and unqualified basic sanitation facilities [30]. Moreover, the components of the house that do not meet the health requirements, which can increase the risk of diseases for the house's occupants [31]. For example, humidity, lighting, and the width of the house ventilation are related to pneumonia in toddlers. The occurrence of environmental-based diseases such as tuberculosis is also influenced by socio-economic conditions [28].
The Sustainable Development Goals (SDGs) number 6 mentions sanitation. The accomplishment of this objective is connected to other SDGs, including 3 (a healthy life) and 11 (urban resilience) [32]. Qualified sanitation is related to access to clean water, whereas Samarinda is dominated by slopes or peaks in terms of topography or land surface conditions. These topographical conditions cause water flow on the ground surface in the Sub-district of Dadi Mulya, Sidodadi, and Bukit Pinang to be less smooth; consequently, some areas still need help getting proper clean water. Moreover, the coverage of the PDAM Tirta Kencana Samarinda pipeline is only partially able to reach the slopes or peaks.
The community-based total sanitation approach shows that triggering in rural communities can reach ODF status within one month [33]. CLTS experiences come from rural areas, but this method applies to urban areas and informal settlements. The impact of urbanization will cause slum settlements, with the CLTS approach to urban communities and leaders promoting ODF with the aim of the community building toilets and improving sanitation facilities. Efforts made by leaders to overcome the impact of urbanization with CLTS have succeeded in improving sanitation conditions in urban areas influenced by essential elements such as subsidies, leaders, and politics [27].
One of the risk factors frequently associated with environment-based diseases, such as diarrhea and stunting, is caused by people who openly defecate, do not wash their hands with soap, and improperly manage household drinking water, food, waste, and domestic wastewater. Those are the leading causes of the emergence of infectious diseases. Toddlers may lose weight due to infectious infections that disrupt the digestive system's ability to absorb nutrients. Toddlers may have stunting if this situation persists for a long time without being accompanied by enough nourishment for the recovery process [15].
A house is a place that must protect and improve the health status of the community. Therefore, policies related to properly sanitized houses must be optimized continually. Assisting people experiencing poverty to build houses with qualified sanitation can be a solution to increase the percentage of healthy houses in Indonesia, such as the program implemented by the Tangerang City government called the Healthy Simple House Development program. Providing stimulus through assistance for healthy houses is expected to help people who experience financial constraints in building healthy houses [32], [33]. Furthermore, it is necessary to conduct massive socialization regarding healthy house regulations in the community [34].
By knowing the distribution pattern and location of the houses categorized as not fulfilling the qualified sanitation, implementing the healthy housing development program can be more effective or correct for the target. Any information related to the assessment of house conditions can assist the government in designing healthy housing programs according to the needs of society. A society with a middle-lower income must be prioritized for the assistance of healthy housing programs to improve its health status. The Geographic Information System provides complete assistance in explaining the distribution of a case. Thus, it can be followed up with a cluster analysis, which can be a potential tool that can greatly assist in determining a policy intervention strategy [35].
Dense urban environments such as Samarinda cost infrastructure services beyond the means of people experiencing poverty and require government subsidies. Through the CLTS Plus program, the Indonesian government is trying to provide a solution for people experiencing poverty by providing subsidies to fulfill sanitation facilities. This program successfully addresses sanitation services in a sustainable manner in urban and peri-urban contexts. People constrained by economic problems can improve their need for proper sanitation within one year.
CONCLUSION
This study concludes that the spatial pattern of house distribution with the category of total sanitation in the Samarinda Ulu area forms clusters or groups at specific locations.” Figures and Tables: Figures and tables are valuable, but some improvements can enhance clarity. Provide a more detailed description of Fig. (1) and its implications.
AUTHORS’ CONTRIBUTIONS
Yuliawati Ratna contributed to the conceptualization, Hanifa Maher Denny contributed to the methodology, Sutopo Patria Jati contributed to the formal analysis, and Yusniar Hanani D contributed in collecting data.
LIST OF ABBREVIATIONS
| ANN | = Average Nearest Neighbor |
| ANOVA | = Analysis of Variance |
| Sustainable Development Goals | = SDGs |
ETHICS APPROVAL AND CONSENT TO PARTICIPATE
This research has gained ethical approval from the Faculty of Public Health Diponegoro University and Certificate number 393/EA/KEPK-FKM/2022.
HUMAN AND ANIMAL RIGHTS
No animals were used in this research. All procedures performed in studies involving human participants were in accordance with the ethical standards of institutional and/or research committees and with the 1975 Declaration of Helsinki, as revised in 2013.
FUNDING
This study was funded by Ministry of Health of the Republic of Indonesia, Decree of the Director of Environmental Health No HK.02.03/5/390/2021. Regarding the determination of Village/Kelurahan Village Cash Intensive Activities (PKTD) Management of the STBM Plus Kesling intervention in overcoming stunting and TB in 2021.