All published articles of this journal are available on ScienceDirect.

Multiple Correspondence Analysis for Assessment of the Socioeconomic and Social Impact of the COVID-19 Pandemic in Gezira State, Sudan
Authors Info & Affiliations
Abstract
Background
COVID-19 spread in Sudan like other countries in the world. The first COVID-19 case in Sudan was confirmed on 13 March 2020. It has been shown that Sudan's economy was affected before the COVID-19 pandemic because of currency increases, high inflation, and the incapability of the authorities to propose support.
Methods
The study aimed to assess the economic and social influence of COVID-19 in Al Gazira State, Sudan. This study used the primary data collected from Gezira state in Sudan. A structured questionnaire was used for data collection in 2020-2021, and the sample size was 800 participants. An analysis of multiple correspondences was used to analyze the data concerning COVID-19. The study was validated by ensuring that the survey follows sound research methodologies. This includes clearly defining research questions, using appropriate data collection methods, and applying rigorous analytical techniques. Besides that, it is important to explore the impact of the socioeconomic, demographic, and geographic variables.
Results
The educational level distribution shows that 36.7% of urban and 26.6% of rural residents have completed secondary education. Furthermore, all participants, 100% in urban regions and 99% in rural areas, were aware of the COVID-19 epidemic. Likewise, all participants in urban areas and 99.5% in rural areas were informed about the lockdowns and measures to curb the spread of COVID-19. Concerning the decision to refrain from attending social gatherings amid COVID-19, 87.6% of participants in urban areas and 75.3% in rural regions opted to cancel such events. Similarly, 86.2% in urban areas and 73.4% in rural areas believe avoiding handshakes is necessary to mitigate the spread of COVID-19. Regarding concerns about job loss during the COVID-19 lockdown period, 52.4% of rural participants did not express anxiety about potential job loss. Conversely, 55.3% of respondents in rural areas were indeed anxious about possibly losing their jobs. The results obtained from the multiple correspondence analysis revealed a relationship between the socioeconomic and demographic variables concerning COVID-19 epidemics.
Conclusion
This study concluded that socioeconomic, demographic, and geographic variables have a combined influence on the COVID-19 epidemic. One potential technical contribution to the assessment of the economic and social impact of the COVID-19 pandemic could be the application of sophisticated data analysis and modeling techniques to comprehend the complex interrelationships among the numerous components impacted by the pathogen. Predictive models, machine learning, data analytics, simulation studies, and geographic analysis are a few examples of similar techniques.
1. INTRODUCTION
Since December 2019, Wuhan, Hubei province, China, experienced many unfamiliar pneumonia infections [1-3]. COVID-19 has become a common pandemic within a few months in Wuhan, China. COVID-19 was classified as a public health threat of international concern by the World Health Organization (WHO) as of January 30, 2020 [1, 4-6]. According to a World Bank report, Despite pandemic-related lockdowns being relaxed in many countries, global growth was estimated to reach 5.5% in 2021, its highest post-recession rate in 80 years [7]. On March 13, 2020, the first COVID-19 case was confirmed in Sudan. Sudan’s government declared COVID-19 a public health emergency over fears of the virus spreading on 16th March [8] it has been shown that, the Sudanese economy was already stressed due to currency increases, high inflation rates, and the incapability of the authorities to offer support before the COVID-19 pandemic [9]. A study showed that people with heightened response to the COVID-19 pandemic who applied for protection and social trust had the highest efforts, even though they fell behind other dimensions [10]. As a result of the COVID-19 outbreak, it has been suggested that government authorities should take all measures to mitigate the adverse effects on learning about the epidemic [11]. The study evaluated that COVID-19 will affect African economies negatively by about 1.4% in GDP, with smaller economies facing a reduction of up to 7.8% [12]. The study revealed that during the COVID-19 pandemic, countries lost 10% to 30% of their future economic growth rate. In other scenarios, they may lose 21% to 68% [13]. The pandemic led to reduced workers across all economic areas and caused many industries to shut down, reducing working opportunities [14]. On the impact of COVID-19 on household finance, 74.3% questioned in October-November 2020 said they were making less than they were in January 2020 [15]. The pandemic affected people's social lives in many ways, such as social distance and self-isolation, travel restrictions, job loss, and increased need for medical supplies [16-18]. A recent study revealed that among 341 participants, 66.9% informed household income loss due to the influence of COVID-19 [19]. The study conducted in Sudan indicates that more than 70% of the participants were well-informed and adopted basic hygiene and social distancing measures [20]. A study revealed that the consequence of the COVID-19 pandemic on Sudan's economy led to many issues, such as a decrease in national revenue by 46%, interruptions in the labor market of employment and the export/import operation due to the lockdown, and low fruitful capacity in the micro, small and medium enterprises [21]. During COVID-19, the steps taken were effective in safeguarding household earnings as a whole. While initially receiving less attention, the situation of self-employed individuals was eventually addressed after the initial emphasis on employees [22]. Enforcing social distancing through limiting large gatherings, imple- menting nationwide or partial lockdowns, and other measures are crucial in combating the pandemic. Nonetheless, these measures pose significant challenges to the normal functioning of society and addressing public concerns to devise effective strategies to tackle global pandemic situations is imperative [23].
The COVID-19 epidemic seriously threatens the economies of developing nations and those of Arab and African countries. Among the nations impacted by the pandemic is Sudan. Investigating the financial impact of coronaviruses on households is essential for managing present and upcoming plans and countermeasures to mitigate this effect. The economic impact of coronavirus on individuals and families has not been thoroughly investigated, leaving a dearth of information to determine the scope of the issue and identify practical mitigation strategies. The study aimed to look into how the COVID-19 epidemic affected Al Gazeera State, Sudan, on a social and economic level.
2. MATERIALS AND METHODS
2.1. Statistical Model
MCA is a method of extending correspondence analysis (CA). Furthermore, it is a multivariate exploratory method aimed at reducing the dimensionality of a categorical data set utilizing uncorrelated factors that maximize the projection distances between the different categories of the variables considered [24-27]. The MCA method does not require any assumptions about the structure of the data, unlike Ordinary Least Square (OLS) regression. Instead, the method determines the association structure between variables and objects [28, 29]. Using MCA, patterns of relationships can be described distinctively by identifying each variable or unit as a unit in a low-dimensional space. MCA can be used to map variables as well as individuals, permitting the structure of complex visual maps with interpretable structures [30]. Furthermore, this method suggests joining both variable-centered and case-centered methods.
Assume cases on categorical factors. Suppose different values for factor . Let matrix that is matrix. The matrix is the indicator matrix. The matrix with the sum of is the concatenated ‘s [26].  Overall, MCA is explained as using weighted PCA to the indicator matrix G. Additionally, G is found by dividing its grand total n x p of the correspondence matrix
  , i.e., 1tn1q = 1, where 1i is an i x 1 vector. The marginal column vectors are r = F1q and c = Ft1n. The expression contains the vectors of row and column masses. Assume the diagonal matrices of the masses are expressed as Dr = diag(r) and Dc = diag(c). Therefore, ith the element of r is fi. = i / n and the sth element of is fi. = ns / np where ns is the frequency of category. MCA is the application of PCA to the centered matrix D-1r(F-rct) and is given by D-1c the chi-squared metric defined by between profile distances. The predictable coordinate of the principal axes is defined as row principal coordinates. matrix X (n x k) of row principal coordinates is expressed by
Where 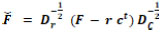 and Vk is the q x k matrix of eigenvectors equivalent to the k largest eigenvalues λ1.......λk of the matrix
  . A row profile can be expressed in different planes using the principal axes called row principal planes [31].
In column profiles, categories are expressed. Divide the column marginals F by their columns to find the value. To double-analyze column profiles, it is possible to exchange rows with columns and all related entities. The value is obtained by transposing and repeating all steps on the Matrix F. The principal axes (weighted PCA) of the centered profiles matrix are given by 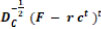 are Dc and D-1r.
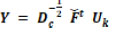
The q x k matrix Y of columns' principal coordinates is defined by
 |
(1) |
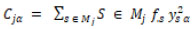
where Uk is n x k matrix of eigenvectors equivalent to the k largest eigenvalues λ1........λk of the matrix  . To support the conception and explanation of the predictable column profiles in the planes given by principal axes, column principal planes are plotted [32]. The complete input of the factor j to the inertia of the column principal component in α the αth column of Y is expressed by
 |
(2) |
Where Mj is the set of categories of variable j. The association among the complete Input Cjα and the correlation ratio among the factors j and α is the row standard component is given by
 |
(3) |
The correlation ratios (factor loadings for PCA) are known as discrimination measures because they represent correlations between variables and components. In MCA, the values can be expressed as squared loadings. Suppose  and
and  where
where  Let
Let  .
.
Therefore, the association shows that the lower rank estimate is different. Additionally, the MCA outcome X* and Y, are different over orthogonal rotations. The explanation of the original outcome by exploring the non-uniqueness can be improved. The column principal coordinates matrix Y of the rotation of the simple structure is followed by the same rotation of the row standard coordinates matrix X*. The explanation of the correlation ratios is basic to use the matrices Y and X* by rotation [33].
The Varimax-based function rotation is used. The result of the rotation of X* and Y, become
 |
(4) |
Where  is the correlation ratio among the variable j and αth column of
  .
.
2.2. The Source of Data
The study depended on the primary data from Gezira, a state in Sudan. A structured questionnaire was used for data collection in 2020-2021. The questionnaire was designed to collect data concerning the variables related to COVID-19. Verbal consent has been obtained from all the participants, and ethical approval has been given by Algezira University.
2.3. Sample Size and Study Design
This study was conducted in the Gezira state. The study depends on the questionnaire covering six localities: Wad Madani Greater, South Gezira, Al-managil, East Gezira, Alkamilin, Hasahisa, and Umm Al-Qura Localities. Verbal consent has been obtained from all the participants, and ethical approval has been given by Algezira University.
The study applied cluster random sampling. The random sampling method in any society estimates the dependent variable when the statistical population is homogeneous. Now, the final sample size according to the confidence rate in the parameter estimation (P 95%) is 400, if the researcher takes a circular approximation. The effect of the random sample design cannot be used due to the heterogeneity of the communities; the researcher revised the design to a multi-stage cluster sample by multiplying it by the design effect which is equal to 2 so the sample size (n = 400*2).
3. RESULTS
Demographic and socioeconomic factors of respondents for the coronavirus pandemic are given in Table 1. Based on the table's results, 44.8% of the respondents reside in the urban Greater Madani regions, followed by south Algazera, Almanagel, Almanagel, East Algazera, and Alkamleen and Um Al, Qura. On the contrary, 34.4% of urban respondents reside in the Almanagel region, followed by South Algazera, Al, Hasahisa, East Algazera, Alkamleen, and Um Al, Qura. 31.4% of the urban and 30.3% of rural respondents are between 36 and 45. The educational level distribution shows that 36.7% of urban and 26.6% of rural residents have completed secondary education. Only 3.2% of rural and 3.3% of urban residents have higher education. Based on the results, 79% of urban and 72.9% of rural residents are married, and 2.9% of urban and 5.3% of rural respondents are a widower and separated, respectively. The survey indicates that 28% of urban and 37.5% of rural respondents have the family's primary source of livelihood through wages and salaries. Only 1% of urban respondents have the family's primary source of livelihood through wages and salaries, humanitarian aid, and private business. As a result, 40% of urban residents have used coal as the main type of fuel used for cooking, followed by gas (38.6%), gas and coal, and charcoal and firewood. On the contrary, 39.3% of rural residents used gas as the primary source of fuel for cooking, followed by coal and wood.
| - | Region | |||||||||||
|---|---|---|---|---|---|---|---|---|---|---|---|---|
| Rural | Urban | |||||||||||
| Sex | Sex | |||||||||||
| Male | Female | Total | Male | Female | Total | |||||||
| No. | % | No. | % | No. | % | No. | % | No. | % | No. | % | |
| Localities | ||||||||||||
| Greater Madani | 0 | 0.0% | 0 | 0.0% | 0 | 0.0% | 47 | 42.7% | 47 | 47.0% | 94 | 44.8% |
| Um Al, Qura | 19 | 5.6% | 21 | 8.3% | 40 | 6.8% | 5 | 4.5% | 4 | 4.0% | 9 | 4.3% |
| Almanagel | 93 | 27.6% | 87 | 34.4% | 180 | 30.5% | 10 | 9.1% | 12 | 12.0% | 22 | 10.5% |
| south algazera | 47 | 13.9% | 43 | 17.0% | 90 | 15.3% | 16 | 14.5% | 16 | 16.0% | 32 | 15.2% |
| Al, Hasahisa | 68 | 20.2% | 42 | 16.6% | 110 | 18.6% | 13 | 11.8% | 14 | 14.0% | 27 | 12.9% |
| East algazera | 56 | 16.6% | 34 | 13.4% | 90 | 15.3% | 10 | 9.1% | 6 | 6.0% | 16 | 7.6% |
| Alkamleen | 54 | 16.0% | 26 | 10.3% | 80 | 13.6% | 9 | 8.2% | 1 | 1.0% | 10 | 4.8% |
| Age group | ||||||||||||
| <= 25 | 26 | 7.7% | 20 | 7.9% | 46 | 7.8% | 4 | 3.6% | 6 | 6.0% | 10 | 4.8% |
| 26 – 35 | 62 | 18.4% | 79 | 31.2% | 141 | 23.9% | 20 | 18.2% | 29 | 29.0% | 49 | 23.3% |
| 36 – 45 | 85 | 25.2% | 94 | 37.2% | 179 | 30.3% | 26 | 23.6% | 40 | 40.0% | 66 | 31.4% |
| 46 – 55 | 95 | 28.2% | 37 | 14.6% | 132 | 22.4% | 25 | 22.7% | 16 | 16.0% | 41 | 19.5% |
| 56 – 65 | 48 | 14.2% | 15 | 5.9% | 63 | 10.7% | 23 | 20.9% | 8 | 8.0% | 31 | 14.8% |
| 65+ | 21 | 6.2% | 8 | 3.2% | 29 | 4.9% | 12 | 10.9% | 1 | 1.0% | 13 | 6.2% |
| Educational level | ||||||||||||
| Illiterte | 50 | 14.8% | 42 | 16.6% | 92 | 15.6% | 11 | 10.0% | 8 | 8.0% | 19 | 9.0% |
| Primary | 89 | 26.4% | 61 | 24.1% | 150 | 25.4% | 24 | 21.8% | 21 | 21.0% | 45 | 21.4% |
| secondary | 100 | 29.7% | 57 | 22.5% | 157 | 26.6% | 46 | 41.8% | 31 | 31.0% | 77 | 36.7% |
| Colledge | 89 | 26.4% | 83 | 32.8% | 172 | 29.2% | 27 | 24.5% | 35 | 35.0% | 62 | 29.5% |
| Higher | 9 | 2.7% | 10 | 4.0% | 19 | 3.2% | 2 | 1.8% | 5 | 5.0% | 7 | 3.3% |
| Marital status | ||||||||||||
| Single | 52 | 15.4% | 25 | 9.9% | 77 | 13.1% | 13 | 11.8% | 11 | 11.0% | 24 | 11.4% |
| Married | 272 | 80.7% | 158 | 62.5% | 430 | 72.9% | 93 | 84.5% | 73 | 73.0% | 166 | 79.0% |
| Widower | 6 | 1.8% | 40 | 15.8% | 46 | 7.8% | 1 | 0.9% | 5 | 5.0% | 6 | 2.9% |
| Separated | 7 | 1.5% | 30 | 10.3% | 37 | 5.3% | 3 | 2.7% | 11 | 11.0% | 14 | 6.7% |
| - | - | - | - | - | - | - | - | - | - | - | - | - |
| The main source of livelihood for the family | ||||||||||||
| Livestock | 20 | 5.9% | 16 | 6.3% | 36 | 6.1% | 7 | 6.4% | 5 | 5.0% | 5.0% | 5.0% |
| From agriculture | 72 | 21.4% | 35 | 13.8% | 107 | 18.1% | 15 | 13.6% | 6 | 6.0% | 6.0% | 6.0% |
| Own business | 75 | 22.3% | 41 | 16.2% | 116 | 19.7% | 34 | 30.9% | 22 | 22.0% | 22.0% | 22.0% |
| Wages and salaries | 108 | 32.0% | 113 | 44.7% | 221 | 37.5% | 33 | 30.0% | 28 | 28.0% | 28.0% | 28.0% |
| Humanitarian aid | 2 | 0.6% | 7 | 2.8% | 9 | 1.5% | 2 | 1.8% | 5 | 5.0% | 5.0% | 5.0% |
| Light industries | 15 | 4.5% | 15 | 5.9% | 30 | 5.1% | 7 | 6.4% | 8 | 8.0% | 8.0% | 8.0% |
| From agriculture, own business | 5 | 1.5% | 4 | 1.6% | 9 | 1.5% | 1 | 0.9% | 1 | 1.0% | 1.0% | 1.0% |
| Livestock, private business | 4 | 1.2% | 1 | 0.4% | 5 | 0.8% | 1 | 0.9% | 3 | 3.0% | 3.0% | 3.0% |
| Own business, wages and salaries | 5 | 1.5% | 2 | 0.8% | 7 | 1.2% | 1 | 0.9% | 7 | 7.0% | 7.0% | 7.0% |
| Wages and salaries, humanitarian aid | 2 | 0.6% | 0 | 0.0% | 2 | 0.3% | 0 | 0.0% | 1 | 1.0% | 1.0% | 1.0% |
| Private business, humanitarian aid | 3 | 0.9% | 1 | 0.4% | 4 | 0.7% | 1 | 0.9% | 1 | 1.0% | 1.0% | 1.0% |
| Private business, light industry | 2 | 0.6% | 0 | 0.0% | 2 | 0.3% | 0 | 0.0% | 2 | 2.0% | 2.0% | 2.0% |
| From agriculture, wages and salaries | 7 | 2.1% | 2 | 0.8% | 9 | 1.5% | 3 | 2.7% | 3 | 3.0% | 3.0% | 3.0% |
| Livestock - from agriculture | 14 | 4.2% | 9 | 3.6% | 23 | 3.9% | 1 | 0.9% | 3 | 3.0% | 3.0% | 3.0% |
| Other | 3 | 0.9% | 7 | 2.8% | 10 | 1.7% | 4 | 3.6% | 5 | 5.0% | 5.0% | 5.0% |
| The type of fuel used for cooking | ||||||||||||
| Gas | 136 | 40.4% | 96 | 37.9% | 232 | 39.3% | 52 | 47.3% | 29 | 29.0% | 81 | 38.6% |
| coal | 107 | 31.8% | 94 | 37.2% | 201 | 34.1% | 36 | 32.7% | 48 | 48.0% | 84 | 40.0% |
| wood | 24 | 7.1% | 25 | 9.9% | 49 | 8.3% | 1 | 0.9% | 2 | 2.0% | 3 | 1.4% |
| Gas and coal | 22 | 6.5% | 11 | 4.3% | 33 | 5.6% | 11 | 10.0% | 8 | 8.0% | 19 | 9.0% |
| Gas and firewood | 13 | 3.9% | 7 | 2.8% | 20 | 3.4% | 1 | 0.9% | 0 | 0.0% | 1 | 0.5% |
| Electricity - Heater | 4 | 1.2% | 0 | 0.0% | 4 | 0.7% | 0 | 0.0% | 3 | 3.0% | 3 | 1.4% |
| Charcoal and firewood | 24 | 7.1% | 12 | 4.7% | 36 | 6.1% | 3 | 2.7% | 4 | 4.0% | 7 | 3.3% |
| Other** | 7 | 2.1% | 8 | 3.2% | 15 | 2.5% | 6 | 5.5% | 6 | 6.0% | 12 | 5.7% |
** Other includes Firewood - Charcoal – Electricity, Charcoal – Electricity and Electricity - gas – coal.
Table 2 represents respondents' knowledge and awareness of COVID-19 to the COVID-19 pandemic in Sudan. Among all respondents, 100% in urban and 99% in rural areas heard about CVID-19 epidemics. Similarly, 100% in urban and 99.5 in rural areas heard about the lockdowns and restrictions imposed to prevent COVID-19 spread. The main source of information about COVID-19 was found to be television for both urban (36.2%) and rural (45.1%). According to the survey, 96.7% of urban and 96.4% of rural residents have no family members with a positive COVID-19 test.
| - | Region | |||||||||||
|---|---|---|---|---|---|---|---|---|---|---|---|---|
| Rural | Urban | |||||||||||
| Sex | Sex | |||||||||||
| Male | Female | Total | Male | Female | Total | |||||||
| No. | % | No. | % | No. | % | No. | % | No. | % | No. | % | |
| The presence of a person with COVID-19 in the family | ||||||||||||
| Yes | 14 | 4.2% | 7 | 2.8% | 21 | 3.6% | 6 | 5.5% | 1 | 1.0% | 7 | 3.3% |
| No | 323 | 95.8% | 246 | 97.2% | 569 | 96.4% | 104 | 94.5% | 99 | 99.0% | 203 | 96.7% |
| - | During the past two months, you had any disease | |||||||||||
| Yes | 103 | 30.6% | 88 | 34.8% | 191 | 32.4% | 36 | 32.7% | 49 | 49.0% | 85 | 40.5% |
| No | 234 | 69.4% | 165 | 65.2% | 399 | 67.6% | 74 | 67.3% | 51 | 51.0% | 125 | 59.5% |
| - | One of the family members suffers from a chronic disease | |||||||||||
| Yes | 115 | 34.1% | 82 | 32.4% | 197 | 33.4% | 39 | 35.5% | 38 | 38.0% | 77 | 36.7% |
| No | 222 | 65.9% | 171 | 67.6% | 393 | 66.6% | 71 | 64.5% | 62 | 62.0% | 133 | 63.3% |
| - | The name of the chronic disease | |||||||||||
| Pressure | 32 | 34.3% | 36 | 22.4% | 68 | 29.3% | 12 | 30.8% | 17 | 18.4% | 29 | 24.7% |
| Diabetes | 37 | 22.2% | 17 | 15.8% | 54 | 19.6% | 12 | 12.8% | 7 | 10.5% | 19 | 11.7% |
| Pressure and diabetes | 24 | 6.5% | 12 | 5.3% | 36 | 6.0% | 5 | 7.7% | 4 | 18.4% | 9 | 13.0% |
| Crisis | 7 | 0.0% | 4 | 0.0% | 11 | 0.0% | 3 | 0.0% | 7 | 0.0% | 10 | 0.0% |
| There is no chronic disease | 0 | 7.4% | 0 | 9.2% | 0 | 8.2% | 0 | 17.9% | 0 | 7.9% | 0 | 13.0% |
| Other* | 8 | 7.4% | 7 | 9.2% | 15 | 8.2% | 7 | 17.9% | 3 | 7.9% | 10 | 13.0% |
| - | Heard of Coronavirus disease | |||||||||||
| Yes | 336 | 99.7% | 248 | 98.0% | 584 | 99.0% | 110 | 100.0% | 100 | 100.0% | 210 | 100.0% |
| No | 1 | 0.3% | 5 | 2.0% | 6 | 1.0% | 0 | 0.0% | 0 | 0.0% | 0 | 0.0% |
| I have heard of coronavirus lockdowns and restrictions | ||||||||||||
| Yes | 336 | 99.7% | 251 | 99.2% | 587 | 99.5% | 110 | 100.0% | 100 | 100.0% | 210 | 100.0% |
| No | 1 | 0.3% | 2 | 0.8% | 3 | 0.5% | 0 | 0.0% | 0 | 0.0% | 0 | 0.0% |
| Your primary source of information related to Coronavirus | ||||||||||||
| Radio | 40 | 11.9% | 28 | 11.1% | 68 | 11.5% | 9 | 8.2% | 15 | 15.0% | 24 | 11.4% |
| Television | 146 | 43.3% | 120 | 47.4% | 266 | 45.1% | 36 | 32.7% | 40 | 40.0% | 76 | 36.2% |
| Newspapers | 7 | 2.1% | 3 | 1.2% | 10 | 1.7% | 3 | 2.7% | 2 | 2.0% | 5 | 2.4% |
| Social media platforms | 39 | 11.6% | 22 | 8.7% | 61 | 10.3% | 15 | 13.6% | 12 | 12.0% | 27 | 12.9% |
| Clubs and gatherings | 16 | 4.7% | 22 | 8.7% | 38 | 6.4% | 9 | 8.2% | 5 | 5.0% | 14 | 6.7% |
| Radio and television | 41 | 12.2% | 28 | 11.1% | 69 | 11.7% | 22 | 20.0% | 9 | 9.0% | 31 | 14.8% |
| Television - social media platforms | 9 | 2.7% | 6 | 2.4% | 15 | 2.5% | 2 | 1.8% | 4 | 4.0% | 6 | 2.9% |
| Radio, television, newspapers | 25 | 7.4% | 12 | 4.7% | 37 | 6.3% | 9 | 8.2% | 9 | 9.0% | 18 | 8.6% |
| Other** | 14 | 4.2% | 12 | 4.7% | 26 | 4.4% | 5 | 4.5% | 4 | 4.0% | 9 | 4.3% |
| You bought one of the following items to prevent or treat corona For the period from March to July 2020 | ||||||||||||
| Hand sanitizer | 53 | 15.7% | 58 | 22.9% | 111 | 18.8% | 29 | 26.4% | 32 | 32.0% | 61 | 29.0% |
| A nose and mouth mask | 89 | 26.4% | 54 | 21.3% | 143 | 24.2% | 47 | 42.7% | 35 | 35.0% | 82 | 39.0% |
| Medicines and vitamins | 21 | 6.2% | 15 | 5.9% | 36 | 6.1% | 4 | 3.6% | 1 | 1.0% | 5 | 2.4% |
| Hand sanitizer, nose and mouth mask, medications and vitamins | 24 | 7.1% | 19 | 7.5% | 43 | 7.3% | 2 | 1.8% | 6 | 6.0% | 8 | 3.8% |
| Hand sanitizer and a nose and mouth mask | 48 | 14.2% | 20 | 7.9% | 68 | 11.5% | 14 | 12.7% | 12 | 12.0% | 26 | 12.4% |
| I did not buy | 100 | 29.7% | 84 | 33.2% | 184 | 31.2% | 13 | 11.8% | 12 | 12.0% | 25 | 11.9% |
| other*** | 2 | 0.6% | 3 | 1.2% | 5 | 0.8% | 1 | 0.9% | 2 | 2.0% | 3 | 1.4% |
| You believe that the government has real reports regarding the spread of the Coronavirus | ||||||||||||
| Very insincere | 46 | 13.6% | 30 | 11.9% | 76 | 12.9% | 30 | 27.3% | 27 | 27.0% | 57 | 27.1% |
| Not honest | 71 | 21.1% | 57 | 22.5% | 128 | 21.7% | 34 | 30.9% | 28 | 28.0% | 62 | 29.5% |
| To some extent | 103 | 30.6% | 77 | 30.4% | 180 | 30.5% | 32 | 29.1% | 27 | 27.0% | 59 | 28.1% |
| Honest | 102 | 30.3% | 71 | 28.1% | 173 | 29.3% | 10 | 9.1% | 12 | 12.0% | 22 | 10.5% |
| Very honest | 15 | 4.5% | 18 | 7.1% | 33 | 5.6% | 4 | 3.6% | 6 | 6.0% | 10 | 4.8% |
**Other includes radio, social media platforms, television, clubs and gatherings, newspapers, social media platforms, television, newspapers.
***Other includes a nose and mouth mask, medications and vitamins, hand sanitizer, medicines and vitamins.
Moreover, 59.5% of urban and 67.6% of rural residents have no family member who has had any disease in the last two months. Similarly, 63.3% and 66.6% of urban and rural residents have no family members who suffer from chronic disease, respectively. Among the respondents with a chronic disease, 24.7% in urban areas and 29.3% in rural areas have high blood pressure, followed by diabetes in rural and both high blood pressure and diabetes in urban areas. To prevent COVID-19, 39% in urban and 24.2% in rural areas bought a nose and mouth mask followed by hand sanitizer (29% urban and 18.8% rural). Among all respondents, 11.9% in urban and 31.2% in rural areas did not buy anything to prevent COVID-19. Regarding the government’s responsibility to give real reports about COVID-19, 29.5% of urban respondents think the government is not honest. The rural respondents (30.5%) believe that the government is somewhat honest.
Regarding canceling participation in social gatherings due to COVID-19, 87.6% in urban and 75.3% in rural areas agreed to cancel the gathering. Similarly, 86.2% in urban and 73.4% in rural areas think that shaking hands must be avoided to prevent COVID-19 spread (Table 3). Regarding the government's response to the current coronavirus outbreak, 41.9% in urban areas and 28.3% in rural areas responded that the response is a very severe reaction and severe reaction, respectively. About 29.5% of urban and 29.3% of rural respondents distrust governments' confidence in care for citizens in response to the COVID-19 epidemic. Regarding social distancing, 35.7% of urban and 34.9% of rural respondents think social distancing is effective.
Moreover, 27.6% of urban and 30% of rural respondents believed that the reported cases of COVID-19 are to some extent accurate. During the COVID-19 epidemic, 31.9% of urban and 37.9% of rural respondents reported that they have not suffered from difficulty sleeping. In addition, 37.1% of urban and 37.5% of rural residents reported about their health. About 35.2% of urban and 33.1% of rural residents are anxious to leave the house to some extent. Regarding supplies at home in normal conditions, 53.3% in urban and 59.5% in rural areas reported that they do not have supplies. 51.4% of urban and 40.8% of rural respondents reported that they usually buy basic supplies from the shops in the big markets and markets regularly, respectively (Table 3).
| - | Region | |||||||||||
|---|---|---|---|---|---|---|---|---|---|---|---|---|
| Rural | Urban | |||||||||||
| Sex | Sex | |||||||||||
| Male | Female | Total | Male | Female | Total | |||||||
| No. | % | No. | % | No. | % | No. | % | No. | % | No. | % | |
| A must for people in the state to cancel their participation in social gatherings due to the Coronavirus | ||||||||||||
| Yes | 256 | 76.0% | 188 | 74.3% | 444 | 75.3% | 96 | 87.3% | 88 | 88.0% | 184 | 87.6% |
| No | 81 | 24.0% | 65 | 25.7% | 146 | 24.7% | 14 | 12.7% | 12 | 12.0% | 26 | 12.4% |
| A must for people in your country not to shake hands with other people because of the Coronavirus now | ||||||||||||
| Yes | 252 | 74.8% | 181 | 71.5% | 433 | 73.4% | 96 | 87.3% | 85 | 85.0% | 181 | 86.2% |
| No | 85 | 25.2% | 72 | 28.5% | 157 | 26.6% | 14 | 12.7% | 15 | 15.0% | 29 | 13.8% |
| All shops in your country, other than those that are particularly important, be closed due to the Coronavirus at the present time | ||||||||||||
| Yes | 159 | 47.2% | 118 | 46.6% | 277 | 46.9% | 66 | 60.0% | 49 | 49.0% | 115 | 54.8% |
| No | 178 | 52.8% | 135 | 53.4% | 313 | 53.1% | 44 | 40.0% | 51 | 51.0% | 95 | 45.2% |
| The government's response to the current coronavirus outbreak | ||||||||||||
| Very severe reaction | 70 | 20.8% | 54 | 21.3% | 124 | 21.0% | 45 | 40.9% | 43 | 43.0% | 88 | 41.9% |
| Severe reaction | 94 | 27.9% | 73 | 28.9% | 167 | 28.3% | 27 | 24.5% | 14 | 14.0% | 41 | 19.5% |
| The reaction is somewhat average | 92 | 27.3% | 53 | 20.9% | 145 | 24.6% | 24 | 21.8% | 28 | 28.0% | 52 | 24.8% |
| Insufficient reaction | 56 | 16.6% | 46 | 18.2% | 102 | 17.3% | 10 | 9.1% | 6 | 6.0% | 16 | 7.6% |
| Reaction is absolutely not enough | 25 | 7.4% | 27 | 10.7% | 52 | 8.8% | 4 | 3.6% | 9 | 9.0% | 13 | 6.2% |
| How confident you are in the government to take care of its citizens | ||||||||||||
| Strongly distrustful | 54 | 16.0% | 31 | 12.3% | 85 | 14.4% | 31 | 28.2% | 20 | 20.0% | 51 | 24.3% |
| Distrust | 78 | 23.1% | 63 | 24.9% | 141 | 23.9% | 30 | 27.3% | 24 | 24.0% | 54 | 25.7% |
| To some extent | 104 | 30.9% | 69 | 27.3% | 173 | 29.3% | 30 | 27.3% | 32 | 32.0% | 62 | 29.5% |
| I trust her | 83 | 24.6% | 74 | 29.2% | 157 | 26.6% | 17 | 15.5% | 19 | 19.0% | 36 | 17.1% |
| I trust her strongly | 18 | 5.3% | 16 | 6.3% | 34 | 5.8% | 2 | 1.8% | 5 | 5.0% | 7 | 3.3% |
| You believe that the government has real reports regarding the spread of the Coronavirus | ||||||||||||
| Very insincere | 46 | 13.6% | 30 | 11.9% | 76 | 12.9% | 30 | 27.3% | 27 | 27.0% | 57 | 27.1% |
| Not honest | 71 | 21.1% | 57 | 22.5% | 128 | 21.7% | 34 | 30.9% | 28 | 28.0% | 62 | 29.5% |
| To some extent | 103 | 30.6% | 77 | 30.4% | 180 | 30.5% | 32 | 29.1% | 27 | 27.0% | 59 | 28.1% |
| Honest | 102 | 30.3% | 71 | 28.1% | 173 | 29.3% | 10 | 9.1% | 12 | 12.0% | 22 | 10.5% |
| Very honest | 15 | 4.5% | 18 | 7.1% | 33 | 5.6% | 4 | 3.6% | 6 | 6.0% | 10 | 4.8% |
| How effective are social distancing measures (for example through a general curfew) to slow the spread of the Coronavirus | ||||||||||||
| Absolutely Ineffective | 44 | 13.1% | 27 | 10.7% | 71 | 12.0% | 22 | 20.0% | 19 | 19.0% | 41 | 19.5% |
| Inactive | 62 | 18.4% | 60 | 23.7% | 122 | 20.7% | 13 | 11.8% | 20 | 20.0% | 33 | 15.7% |
| To some extent | 74 | 22.0% | 52 | 20.6% | 126 | 21.4% | 28 | 25.5% | 13 | 13.0% | 41 | 19.5% |
| Effective | 126 | 37.4% | 80 | 31.6% | 206 | 34.9% | 39 | 35.5% | 36 | 36.0% | 75 | 35.7% |
| Very effective | 31 | 9.2% | 34 | 13.4% | 65 | 11.0% | 8 | 7.3% | 12 | 12.0% | 20 | 9.5% |
| It believes that the reported cases of the disease in the state of the island are | ||||||||||||
| Very accurate | 11 | 3.3% | 19 | 7.5% | 30 | 5.1% | 5 | 4.5% | 6 | 6.0% | 11 | 5.2% |
| Accurate | 87 | 25.8% | 63 | 24.9% | 150 | 25.4% | 9 | 8.2% | 8 | 8.0% | 17 | 8.1% |
| To some extent | 104 | 30.9% | 73 | 28.9% | 177 | 30.0% | 34 | 30.9% | 24 | 24.0% | 58 | 27.6% |
| Inaccurate | 102 | 30.3% | 70 | 27.7% | 172 | 29.2% | 36 | 32.7% | 19 | 19.0% | 55 | 26.2% |
| Quite inaccurate | 33 | 9.8% | 28 | 11.1% | 61 | 10.3% | 26 | 23.6% | 43 | 43.0% | 69 | 32.9% |
| You suffer from difficulty sleeping or sleep a lot | ||||||||||||
| Yes a lot | 42 | 12.5% | 34 | 13.4% | 76 | 12.9% | 6 | 5.5% | 3 | 3.0% | 9 | 4.3% |
| Much | 24 | 7.1% | 34 | 13.4% | 58 | 9.8% | 1 | 0.9% | 7 | 7.0% | 8 | 3.8% |
| To some extent | 68 | 20.2% | 40 | 15.8% | 108 | 18.3% | 34 | 30.9% | 23 | 23.0% | 57 | 27.1% |
| No | 141 | 41.8% | 96 | 37.9% | 237 | 40.2% | 36 | 32.7% | 31 | 31.0% | 67 | 31.9% |
| Not at all | 62 | 18.4% | 49 | 19.4% | 111 | 18.8% | 33 | 30.0% | 36 | 36.0% | 69 | 32.9% |
| You feel nervous when you think about the current circumstances | ||||||||||||
| It does not apply at all | 32 | 9.5% | 21 | 8.3% | 53 | 9.0% | 9 | 8.2% | 10 | 10.0% | 19 | 9.0% |
| Do not apply | 46 | 13.6% | 40 | 15.8% | 86 | 14.6% | 20 | 18.2% | 7 | 7.0% | 27 | 12.9% |
| To some extent | 58 | 17.2% | 38 | 15.0% | 96 | 16.3% | 35 | 31.8% | 23 | 23.0% | 58 | 27.6% |
| Applies | 111 | 32.9% | 72 | 28.5% | 183 | 31.0% | 29 | 26.4% | 42 | 42.0% | 71 | 33.8% |
| Strongly applicable | 90 | 26.7% | 82 | 32.4% | 172 | 29.2% | 17 | 15.5% | 18 | 18.0% | 35 | 16.7% |
| You could say that you are worried about my health | ||||||||||||
| It does not apply at all | 33 | 9.8% | 17 | 6.7% | 50 | 8.5% | 4 | 3.6% | 4 | 4.0% | 8 | 3.8% |
| Do not apply | 41 | 12.2% | 34 | 13.4% | 75 | 12.7% | 18 | 16.4% | 7 | 7.0% | 25 | 11.9% |
| To some extent | 50 | 14.8% | 45 | 17.8% | 95 | 16.1% | 35 | 31.8% | 30 | 30.0% | 65 | 31.0% |
| Applies | 130 | 38.6% | 91 | 36.0% | 221 | 37.5% | 41 | 37.3% | 37 | 37.0% | 78 | 37.1% |
| Strongly applicable | 83 | 24.6% | 66 | 26.1% | 149 | 25.3% | 12 | 10.9% | 22 | 22.0% | 34 | 16.2% |
| You could say you feel anxious when you leave the house | ||||||||||||
| It does not apply at all | 33 | 9.8% | 17 | 6.7% | 50 | 8.5% | 8 | 7.3% | 7 | 7.0% | 15 | 7.1% |
| Do not apply | 63 | 18.7% | 43 | 17.0% | 106 | 18.0% | 17 | 15.5% | 8 | 8.0% | 25 | 11.9% |
| To some extent | 49 | 14.5% | 37 | 14.6% | 86 | 14.6% | 43 | 39.1% | 31 | 31.0% | 74 | 35.2% |
| Applies | 114 | 33.8% | 81 | 32.0% | 195 | 33.1% | 30 | 27.3% | 35 | 35.0% | 65 | 31.0% |
| Strongly applicable | 78 | 23.1% | 75 | 29.6% | 153 | 25.9% | 12 | 10.9% | 19 | 19.0% | 31 | 14.8% |
| You could say that you have reduced your social participation | ||||||||||||
| It does not apply at all | 44 | 13.1% | 21 | 8.3% | 65 | 11.0% | 8 | 7.3% | 6 | 6.0% | 14 | 6.7% |
| Do not apply | 47 | 13.9% | 62 | 24.5% | 109 | 18.5% | 12 | 10.9% | 8 | 8.0% | 20 | 9.5% |
| To some extent | 91 | 27.0% | 68 | 26.9% | 159 | 26.9% | 53 | 48.2% | 35 | 35.0% | 88 | 41.9% |
| Applies | 103 | 30.6% | 64 | 25.3% | 167 | 28.3% | 27 | 24.5% | 33 | 33.0% | 60 | 28.6% |
| Strongly applicable | 52 | 15.4% | 38 | 15.0% | 90 | 15.3% | 10 | 9.1% | 18 | 18.0% | 28 | 13.3% |
| In normal times you have supplies at home in case of an emergency | ||||||||||||
| Yes | 142 | 42.1% | 97 | 38.3% | 239 | 40.5% | 47 | 42.7% | 51 | 51.0% | 98 | 46.7% |
| No | 195 | 57.9% | 156 | 61.7% | 351 | 59.5% | 63 | 57.3% | 49 | 49.0% | 112 | 53.3% |
| You usually buy basic supplies at regular times | ||||||||||||
| Market | 133 | 39.5% | 108 | 42.7% | 241 | 40.8% | 33 | 30.0% | 28 | 28.0% | 61 | 29.0% |
| Shop in the big markets | 123 | 36.5% | 109 | 43.1% | 232 | 39.3% | 55 | 50.0% | 53 | 53.0% | 108 | 51.4% |
| Wholesale retailer | 31 | 9.2% | 20 | 7.9% | 51 | 8.6% | 11 | 10.0% | 12 | 12.0% | 23 | 11.0% |
| Online | 2 | 0.6% | 0 | 0.0% | 2 | 0.3% | 0 | 0.0% | 0 | 0.0% | 0 | 0.0% |
| Several different stores | 9 | 2.7% | 4 | 1.6% | 13 | 2.2% | 1 | 0.9% | 0 | 0.0% | 1 | 0.5% |
| Market, supermarket convenience store | 39 | 11.6% | 12 | 4.7% | 51 | 8.6% | 10 | 9.1% | 7 | 7.0% | 17 | 8.1% |
Table 4 represents the income distribution of respondents. Based on the survey, only 5.7% of urban and 13.7% of rural respondents worked in more than one job. In 49.5% of urban and 55.3% of rural respondents' households, it was found that more than one person worked in the household. Regarding losing jobs during the COVID-19 ban period, 52.4% of rural respondents were not anxious about losing jobs. On the contrary, 55.3% of respondents in rural areas were anxious about losing jobs. In the survey, 61.9% of urban and 54.6% of rural residents reported that their family members were unaffected by a lack of working hours. As indicated in Table 4, 54.3% of urban respondents suggested that the family was affected by a decrease in monthly income. On the contrary, 60% of rural respondents indicated that they were not affected by a decrease in household monthly income. The survey respondents reported that 52.9% of urban and 43.6% of rural respondents buy supplies about five times more than they used to buy before COVID-19.
3.1. Correspondence Analysis
Multiple correspondence analysis is useful to investigate the relations among the socioeconomic, knowledge and awareness, procurement and behavior, and income distribution of respondents. Multiple corres- pondence analysis is a statistical tool to identify the influence of socioeconomic status, knowledge and awareness, procurement and behavior, and income distribution of respondents. Therefore, applying for correspondence analysis benefits by decreasing the interaction parameters. By understanding the data structure, computing time can be significantly decreased. The graphical presentation of the data is important to reduce the level of relations between the examined parameters.
| - | Region | |||||||||||
|---|---|---|---|---|---|---|---|---|---|---|---|---|
| Rural | Urban | |||||||||||
| Sex | Sex | |||||||||||
| Male | Female | Total | Male | Female | Total | |||||||
| No. | % | No. | % | No. | % | No. | % | No. | % | No. | % | |
| If you worked, you work in more than one job | ||||||||||||
| Yes | 60 | 17.8% | 21 | 8.3% | 81 | 13.7% | 7 | 6.4% | 5 | 5.0% | 12 | 5.7% |
| No | 277 | 82.2% | 232 | 91.7% | 509 | 86.3% | 103 | 93.6% | 95 | 95.0% | 198 | 94.3% |
| There are other people working in this house | ||||||||||||
| Yes | 148 | 43.9% | 178 | 70.4% | 326 | 55.3% | 44 | 40.0% | 60 | 60.0% | 104 | 49.5% |
| No | 189 | 56.1% | 75 | 29.6% | 264 | 44.7% | 66 | 60.0% | 40 | 40.0% | 106 | 50.5% |
| Returning to the impact of Corona on business you feel anxious during the ban period about losing your job or its effect on your business in general | ||||||||||||
| Yes | 179 | 53.1% | 134 | 53.0% | 313 | 53.1% | 51 | 46.4% | 49 | 49.0% | 100 | 47.6% |
| No | 158 | 46.9% | 119 | 47.0% | 277 | 46.9% | 59 | 53.6% | 51 | 51.0% | 110 | 52.4% |
| You or a family member been affected by a lack of working hours | ||||||||||||
| Yes | 174 | 51.6% | 94 | 37.2% | 268 | 45.4% | 49 | 44.5% | 31 | 31.0% | 80 | 38.1% |
| No | 163 | 48.4% | 159 | 62.8% | 322 | 54.6% | 61 | 55.5% | 69 | 69.0% | 130 | 61.9% |
| You or any of your family members been affected by the lack of working days per week | ||||||||||||
| Yes | 157 | 46.6% | 91 | 36.0% | 248 | 42.0% | 40 | 36.4% | 22 | 22.0% | 62 | 29.5% |
| No | 180 | 53.4% | 162 | 64.0% | 342 | 58.0% | 70 | 63.6% | 78 | 78.0% | 148 | 70.5% |
| You or a family member been affected by a decrease in your monthly income | ||||||||||||
| Yes | 147 | 43.6% | 89 | 35.2% | 236 | 40.0% | 65 | 59.1% | 49 | 49.0% | 114 | 54.3% |
| No | 190 | 56.4% | 164 | 64.8% | 354 | 60.0% | 45 | 40.9% | 51 | 51.0% | 96 | 45.7% |
| You or a family member lost your permanent job | ||||||||||||
| Yes | 31 | 9.2% | 30 | 11.9% | 61 | 10.3% | 14 | 12.7% | 13 | 13.0% | 27 | 12.9% |
| No | 306 | 90.8% | 223 | 88.1% | 529 | 89.7% | 96 | 87.3% | 87 | 87.0% | 183 | 87.1% |
| You or a family member lost a part-time job | ||||||||||||
| Yes | 69 | 20.5% | 68 | 26.9% | 137 | 23.2% | 34 | 30.9% | 38 | 38.0% | 72 | 34.3% |
| No | 268 | 79.5% | 185 | 73.1% | 453 | 76.8% | 76 | 69.1% | 62 | 62.0% | 138 | 65.7% |
| Number of times you buy supplies before COVID-19 | ||||||||||||
| <= 5 | 141 | 41.8% | 116 | 45.8% | 257 | 43.6% | 60 | 54.5% | 51 | 51.0% | 111 | 52.9% |
| 6 - 10 | 41 | 12.2% | 25 | 9.9% | 66 | 11.2% | 26 | 23.6% | 23 | 23.0% | 49 | 23.3% |
| 11 - 15 | 15 | 4.5% | 14 | 5.5% | 29 | 4.9% | 1 | 0.9% | 2 | 2.0% | 3 | 1.4% |
| 15+ | 140 | 41.5% | 98 | 38.7% | 238 | 40.3% | 23 | 20.9% | 24 | 24.0% | 47 | 22.4% |
| Number of times you buy supplies last year | ||||||||||||
| <= 5 | 118 | 35.0% | 88 | 34.8% | 206 | 34.9% | 67 | 60.9% | 58 | 58.0% | 125 | 59.5% |
| 6 - 10 | 40 | 11.9% | 32 | 12.6% | 72 | 12.2% | 15 | 13.6% | 14 | 14.0% | 29 | 13.8% |
| 11 - 15 | 17 | 5.0% | 15 | 5.9% | 32 | 5.4% | 1 | 0.9% | 2 | 2.0% | 3 | 1.4% |
| 15+ | 162 | 48.1% | 118 | 46.6% | 280 | 47.5% | 27 | 24.5% | 26 | 26.0% | 53 | 25.2% |
| Estimate the number of days of the week you work | ||||||||||||
| <= 5 | 97 | 28.8% | 59 | 23.3% | 156 | 26.4% | 31 | 28.2% | 23 | 23.0% | 54 | 25.7% |
| 6 - 10 | 171 | 50.7% | 50 | 19.8% | 221 | 37.5% | 61 | 55.5% | 45 | 45.0% | 106 | 50.5% |
| > 10 | 69 | 20.5% | 144 | 56.9% | 213 | 36.1% | 18 | 16.4% | 32 | 32.0% | 50 | 23.8% |
| Estimate the number of hours you work before Corona | ||||||||||||
| < = 48 | 242 | 71.8% | 95 | 37.5% | 337 | 57.1% | 88 | 80.0% | 68 | 68.0% | 156 | 74.3% |
| 41 - 80 | 2 | 0.6% | 0 | 0.0% | 2 | 0.3% | 2 | 1.8% | 0 | 0.0% | 2 | 1.0% |
| 80+ | 93 | 27.6% | 158 | 62.5% | 251 | 42.5% | 20 | 18.2% | 32 | 32.0% | 52 | 24.8% |
| Estimate your monthly income before March 2020 | ||||||||||||
| < = 10000 | 95 | 28.2% | 52 | 20.6% | 147 | 24.9% | 17 | 15.5% | 16 | 16.0% | 33 | 15.7% |
| 10001 - 20000 | 23 | 6.8% | 14 | 5.5% | 37 | 6.3% | 2 | 1.8% | 5 | 5.0% | 7 | 3.3% |
| 20001 - 30000 | 20 | 5.9% | 5 | 2.0% | 25 | 4.2% | 1 | 0.9% | 1 | 1.0% | 2 | 1.0% |
| 30001 - 40000 | 3 | 0.9% | 0 | 0.0% | 3 | 0.5% | 0 | 0.0% | 0 | 0.0% | 0 | 0.0% |
| > 40000 | 4 | 1.2% | 1 | 0.4% | 5 | 0.8% | 0 | 0.0% | 0 | 0.0% | 0 | 0.0% |
| Don't know | 120 | 35.6% | 89 | 35.2% | 209 | 35.4% | 64 | 58.2% | 48 | 48.0% | 112 | 53.3% |
| Refused | 72 | 21.4% | 92 | 36.4% | 164 | 27.8% | 26 | 23.6% | 30 | 30.0% | 56 | 26.7% |
| Average family monthly spending on chronic diseases | ||||||||||||
| < = 1000 | 57 | 16.9% | 49 | 19.4% | 106 | 18.0% | 21 | 19.1% | 25 | 25.0% | 46 | 21.9% |
| 1001 - 3000 | 29 | 8.6% | 11 | 4.3% | 40 | 6.8% | 11 | 10.0% | 10 | 10.0% | 21 | 10.0% |
| 3000+ | 251 | 74.5% | 193 | 76.3% | 444 | 75.3% | 78 | 70.9% | 65 | 65.0% | 143 | 68.1% |
| Average monthly spending per household in Sudanese pounds | ||||||||||||
| < = 10000 | 98 | 29.1% | 81 | 32.0% | 179 | 30.3% | 20 | 18.2% | 18 | 18.0% | 38 | 18.1% |
| 10001 - 20000 | 134 | 39.8% | 97 | 38.3% | 231 | 39.2% | 55 | 50.0% | 59 | 59.0% | 114 | 54.3% |
| 20001 - 30000 | 57 | 16.9% | 41 | 16.2% | 98 | 16.6% | 19 | 17.3% | 15 | 15.0% | 34 | 16.2% |
| > 30000 | 32 | 9.5% | 20 | 7.9% | 52 | 8.8% | 11 | 10.0% | 7 | 7.0% | 18 | 8.6% |
| Don't know | 16 | 4.7% | 14 | 5.5% | 30 | 5.1% | 5 | 4.5% | 1 | 1.0% | 6 | 2.9% |
To use MCA, variables are divided into subgroups that cover similar variables such as socioeconomic, knowledge and awareness, procurement and behavior, and income distribution of respondents' variables. Factors examined using MCA are mostly categorical. Therefore, the variable or input to MCA is ordinarily discrete. In 1977, Gutonneau and Roux described this technique [34]. Continuous variables can be categorized using mutually exclusive and complete discretization or coding using MCA [26]. All the categories are in Euclidean space using multiple correspondence analysis. Analyzing the associations among categories requires plotting the first two Euclidean dimensions. Among the variables considered in the multiple correspondence analysis are socioeconomics, knowledge and awareness, procurement and behavior, and income distribution of respondents.
MCA analysis can quantify how much variation each principal dimension accounts for by expressing the total inertia as a percentage. Additionally, each row and column's principal inertia are divided into components. By decomposing the columns and rows, we can interpret the dimensions and display the points in the reduced space with a higher level of quality. To understand how the dimensions are determined, it is helpful to express the parts as percentages considering the respective inertia points in the entire space, the domination.
3.2. Knowledge and Awareness
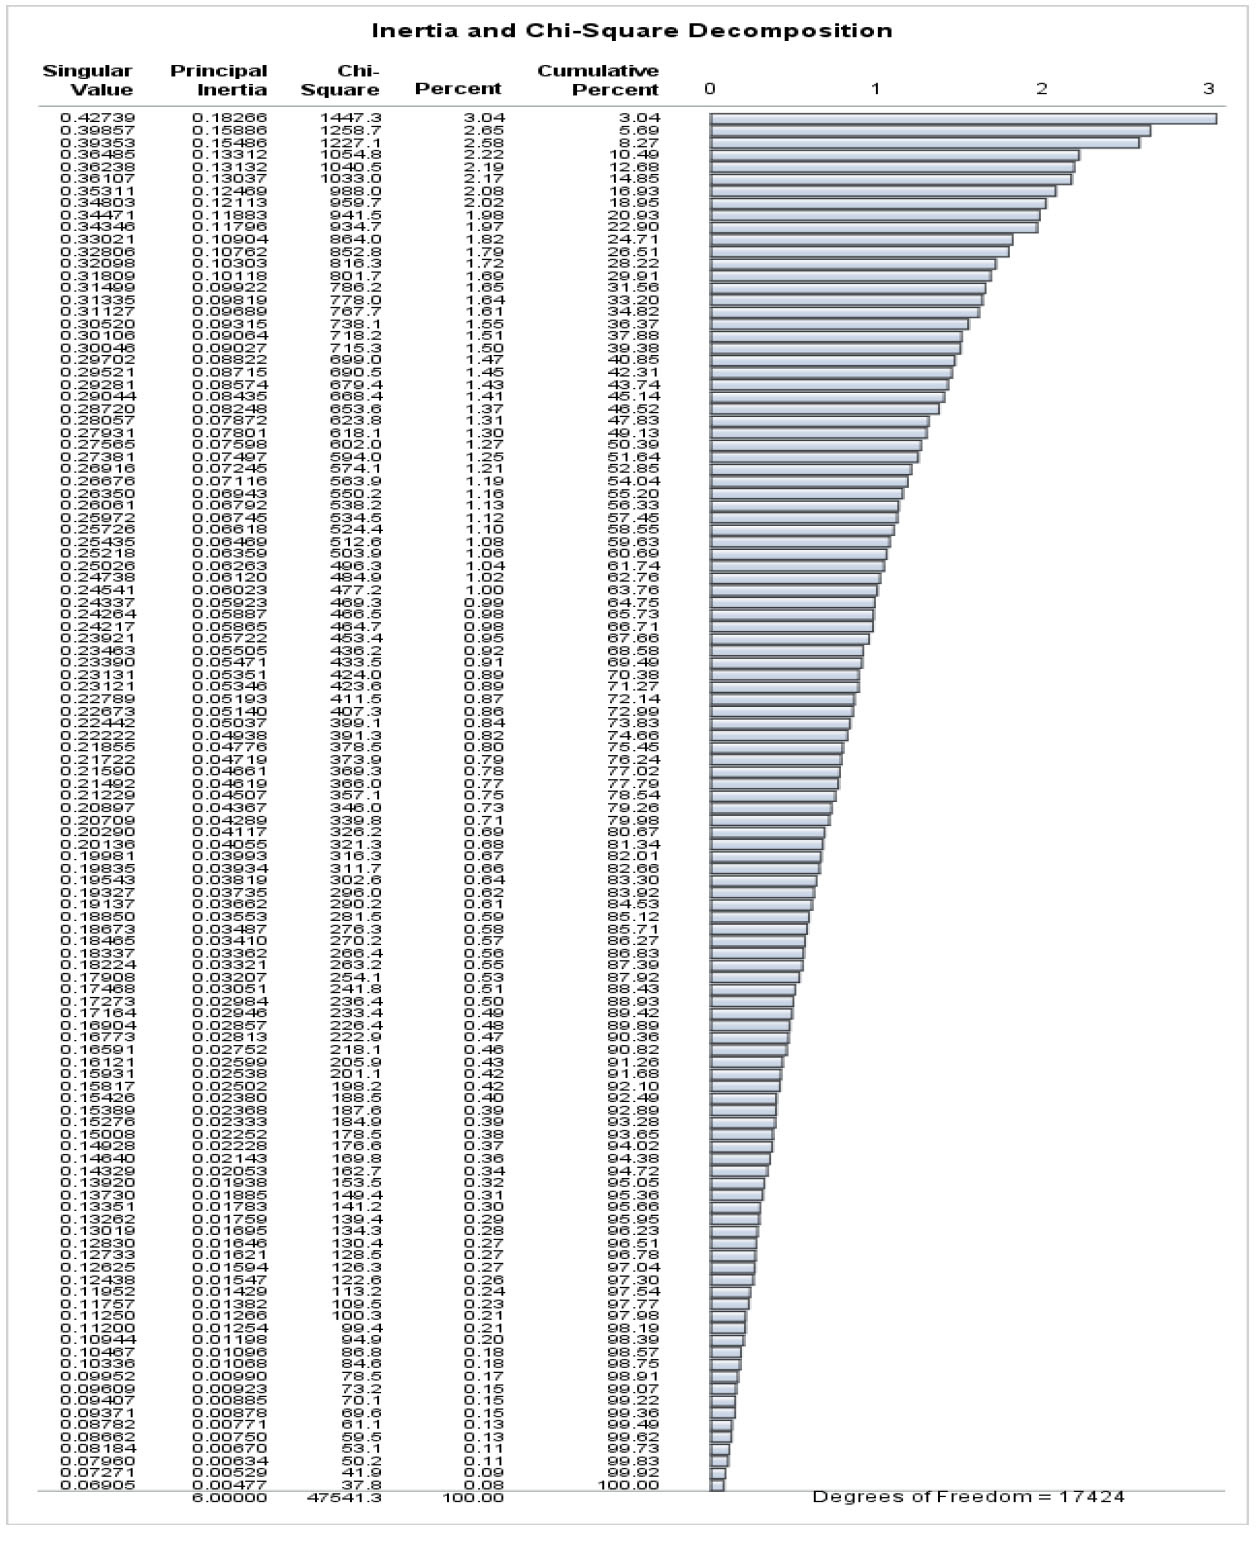
Fig. (1) shows MCA's Chi-Square classification and inertia for knowledge, awareness, and socio-demographic variables. To compute the difference among frequencies of a contingency table in each cell, chi-square distances have been used. Cell independence is the basis for calculating chi-square distances. In this case, it is possible to consider the pairs of cells with the same observed value and expected value independent of one another. As a result, observed and expected results differ in cell pairs. Fig. (1) shows that the ten dimensions account for 20.93% of the total contribution. A total chi-square statistic is shown in Fig. (1). The evaluation indicates how rows and columns relate in a table of full dimensions. The chi-square value is 47541.3 with a degree of freedom of 17424. This chi-square shows all pairwise relations between the factors.
In Fig. (1), the singular value shows how each dimension contributes to explaining the variable profiles' inertia or proportion of dissimilarity. The contingency table's singular values represent correlations between rows and columns. Like the principal component analysis, the greatest amount of variance is given by the first dimension, the second dimension displays the greatest amount of outstanding difference, and so on. When the singular value is more significant than 0.2, the dimension is incorporated into the investigation (Hair et al., 1995). A cut-off point balances the proportion of differences interpreted by each dimension. Inertia is directly related to the singular value, so inertia represents how much difference in the actual data is reserved.
Additionally, the percentage of inertia described by the first thirty-seven axes was found to be 60.69% (Fig. 1). As can be seen from the figure, 81.34% of the interaction can be characterized well in fifty dimensions. However, the data is described in two dimensions (Bendixen, 1996). The first axis accounts for about 3.04% of the inertia, and the second axis accounts for about 5.69%. In MCA, the percentages of inertia leaned towards being close to one another, thus leading to the assumption that individual axes are unbalanced.
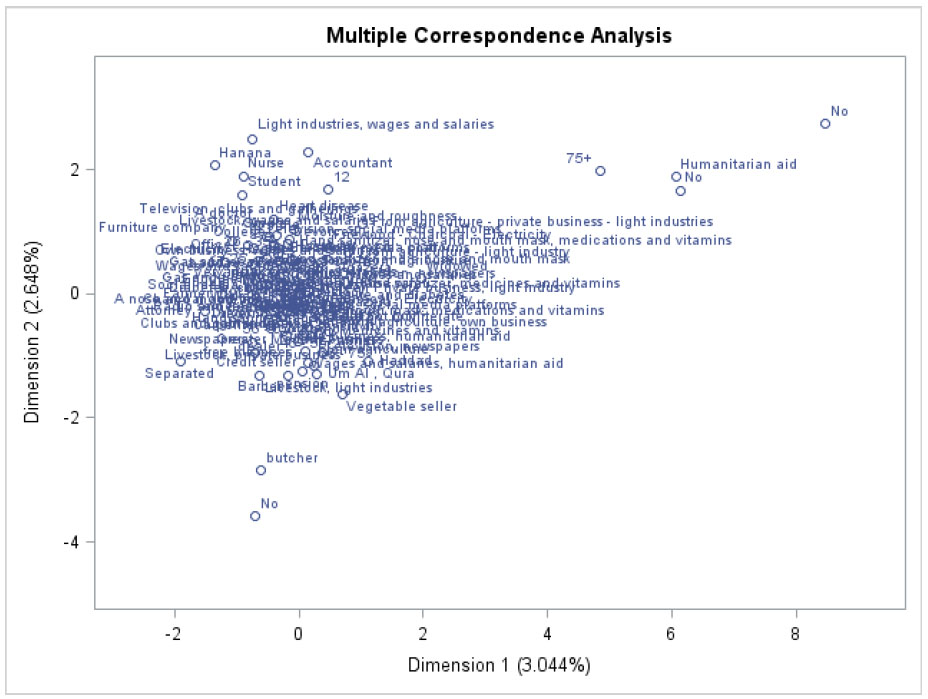
The scaling solution coordinates for dimension 1 and dimension 2, with dimension 1 on the horizontal axis and dimension 2 on the vertical axis, are given in Fig. (2). In Euclidean space, multiple correspondence analysis detects all categories. To explore the relationships between the categories, the first two dimensions of space are presented. In the data, dimension 1 accounted for 3.04 percent of the variance, while dimension 2 accounted for 2.65%. Variables like humanitarian aid, persons aged 75 years and above, wages from light industry, and persons who have butcher occupation appear separated from the group on the right-hand side of the chart. The figure indicates that the rest of the variables are related and have an impact on the COVID-19 epidemic. Consequently, these factors must be comprised in the explanation of dimension 1.
3.3. Procurement and Behavior
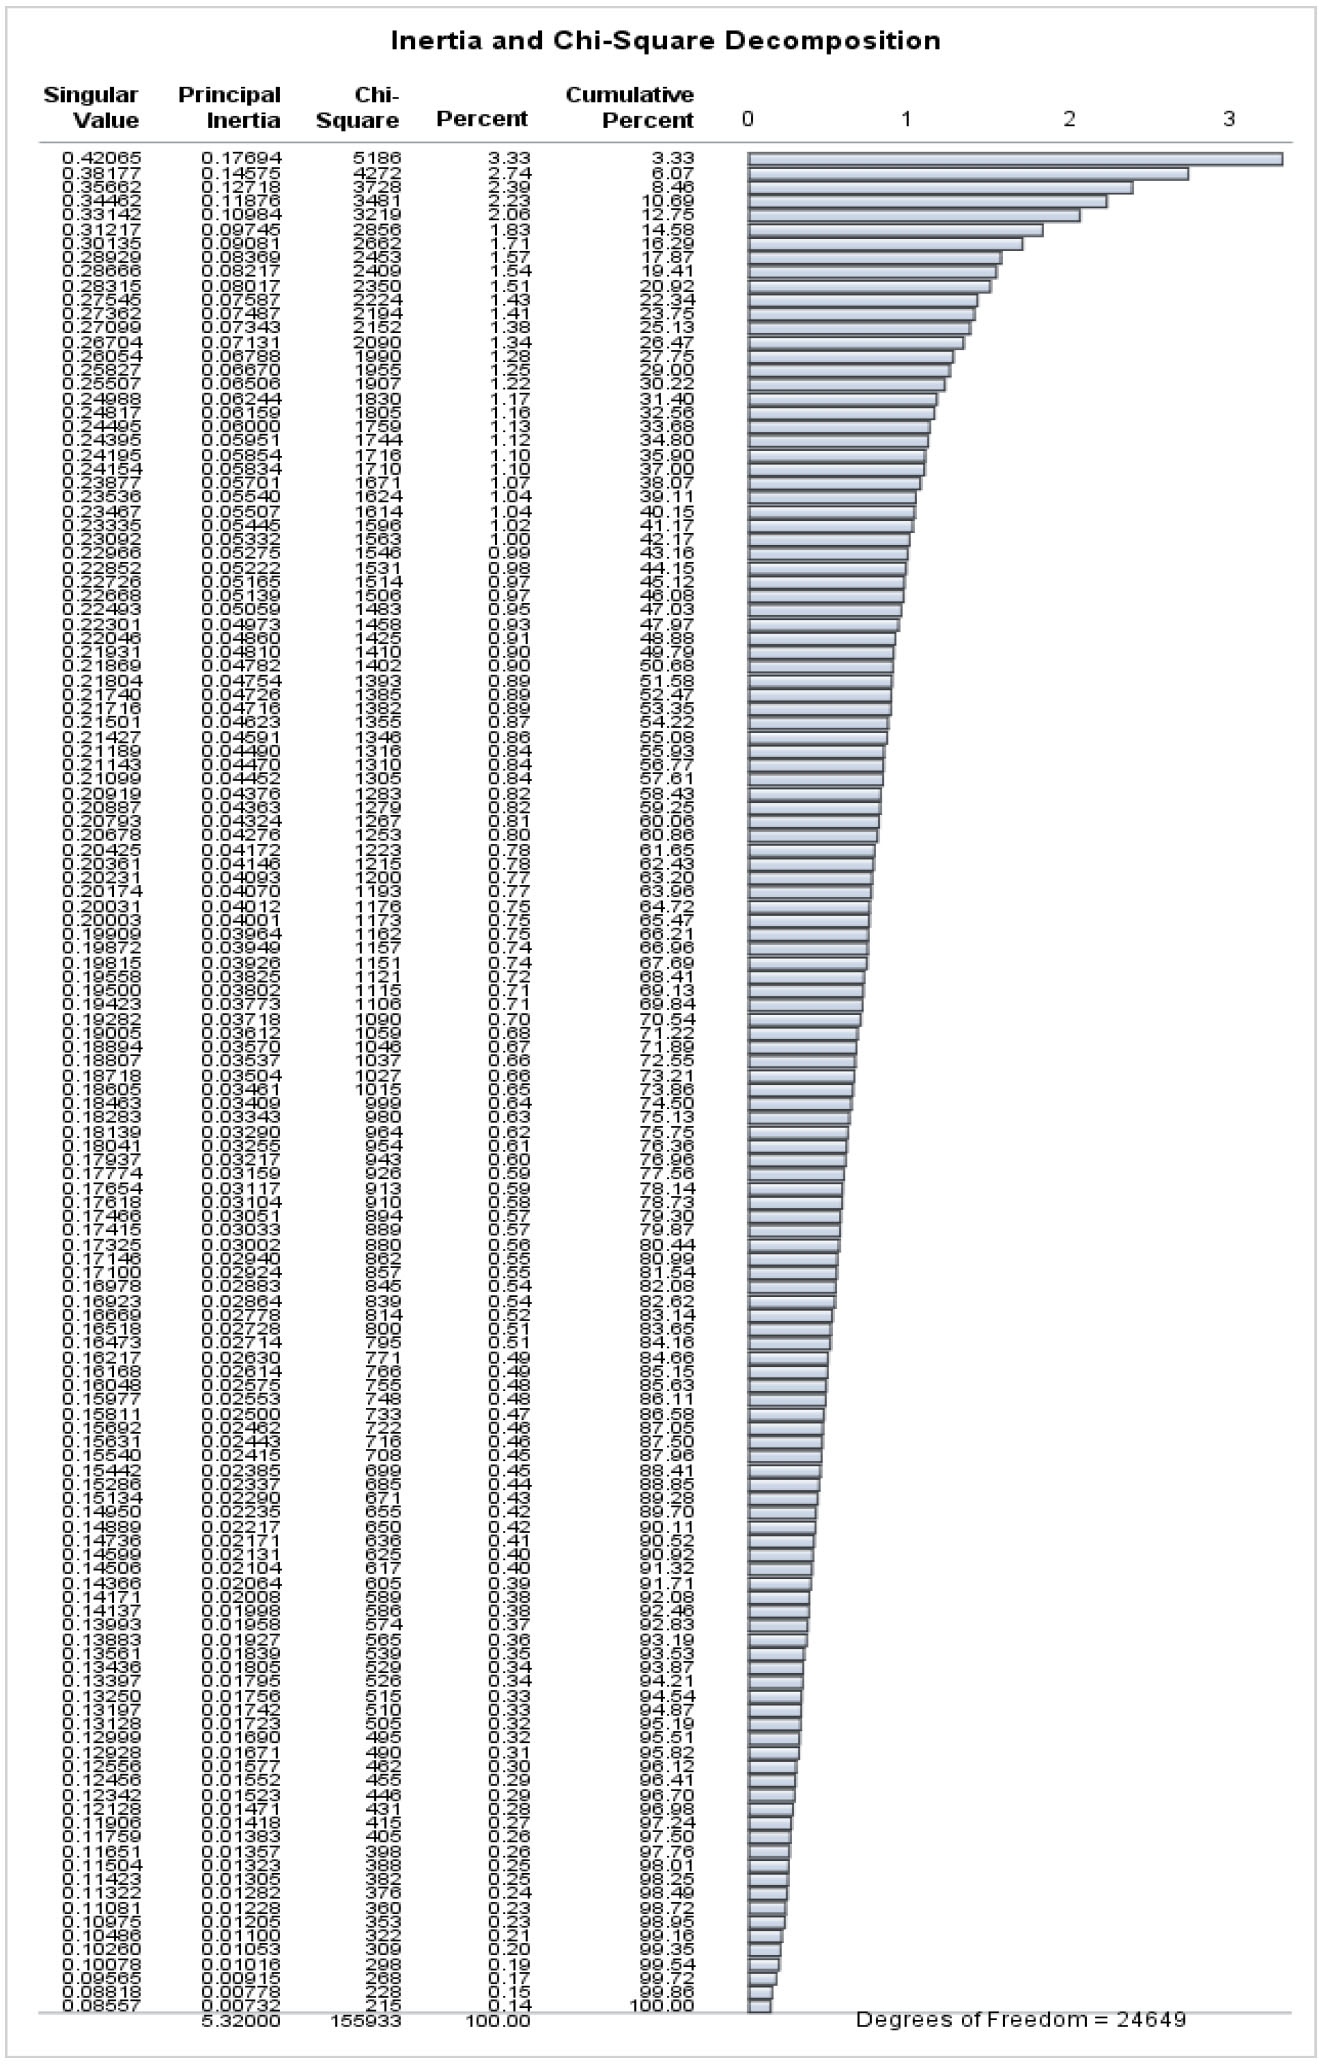
A multiple correspondence analysis showing inertia and Chi-Square decompositions for procurement and behavior variables, along with socio-demographic variables, is shown in Fig. (3). In correspondence analysis, the difference among the frequencies in each contingency table cell is calculated using chi-square distances. Chi-square distances are calculated cell independently. An independent pair of cells is the same for observed and expected values. As a result, pairs of cells with observed and expected values differ. Fig. (3) suggests that 30.22% of the total association can be attributed to seventeen dimensions. Using Fig. (3), the chi-square statistic represents the relationship among the rows and columns in the full dimensions of the table, which is 155933 with a degree of freedom of 24649. Each pairwise association between the factors is represented in this chi-square. The maximum number of dimensions is one less than the minimum number of rows and columns.
Based on Fig. (3), the singular value shows the relative influence of each dimension in explaining the inertia, or amount of differences, between participants and variables. According to the contingency table, singular values represent the correlation among rows and columns.
The percentage of inertia described by the first thirty-seven axes was found to be 50.68% (Fig. 2). As can be seen from the figure, 70.54% of the relation can be characterized in more than fifty dimensions. Nevertheless, these data are measured in two dimensions. Approximately 3.33% of the inertia is accounted for by the first axis and the second axis accounts for approximately 2.74%. MCA shows a low inertia percentage and leans towards each other, which might suggest that individual axes are unstable.
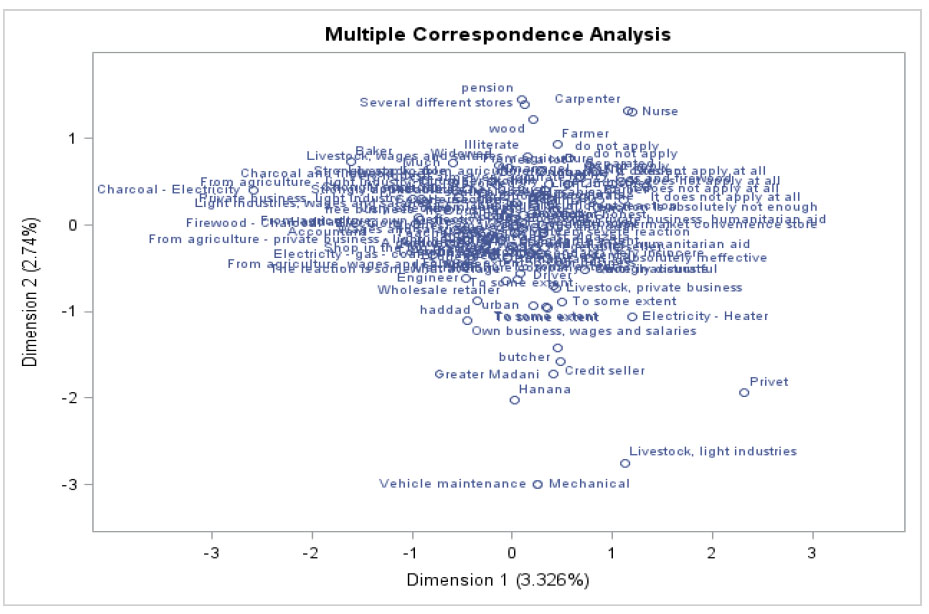
The result in Fig. (4) gives the MCA, and the scaling explanation coordinates for Dimensions 1 and 2. Dimension 1 is on the horizontal axis, while dimension 2 is on the vertical axis. Euclidean space is used to locate each category in multiple correspondence analyses. The two dimensions of the area are plotted to investigate the relations among categories. Dimension 1 explains about 3.33% of the difference in the data, and Dimension 2 covers 2.74% of the variance. Variables like occupation vehicle maintenance, carpenter, income from livestock, pension, butcher credit seller, and persons who bought from several stores appeared separated from the group on the right-hand and left-hand sides of the chart. The figure indicates that the rest of the variables are related and impact the COVID-19 pandemic. Consequently, the variables included in the interpretation of dimension 1.
3.4. Income Distribution of Respondents
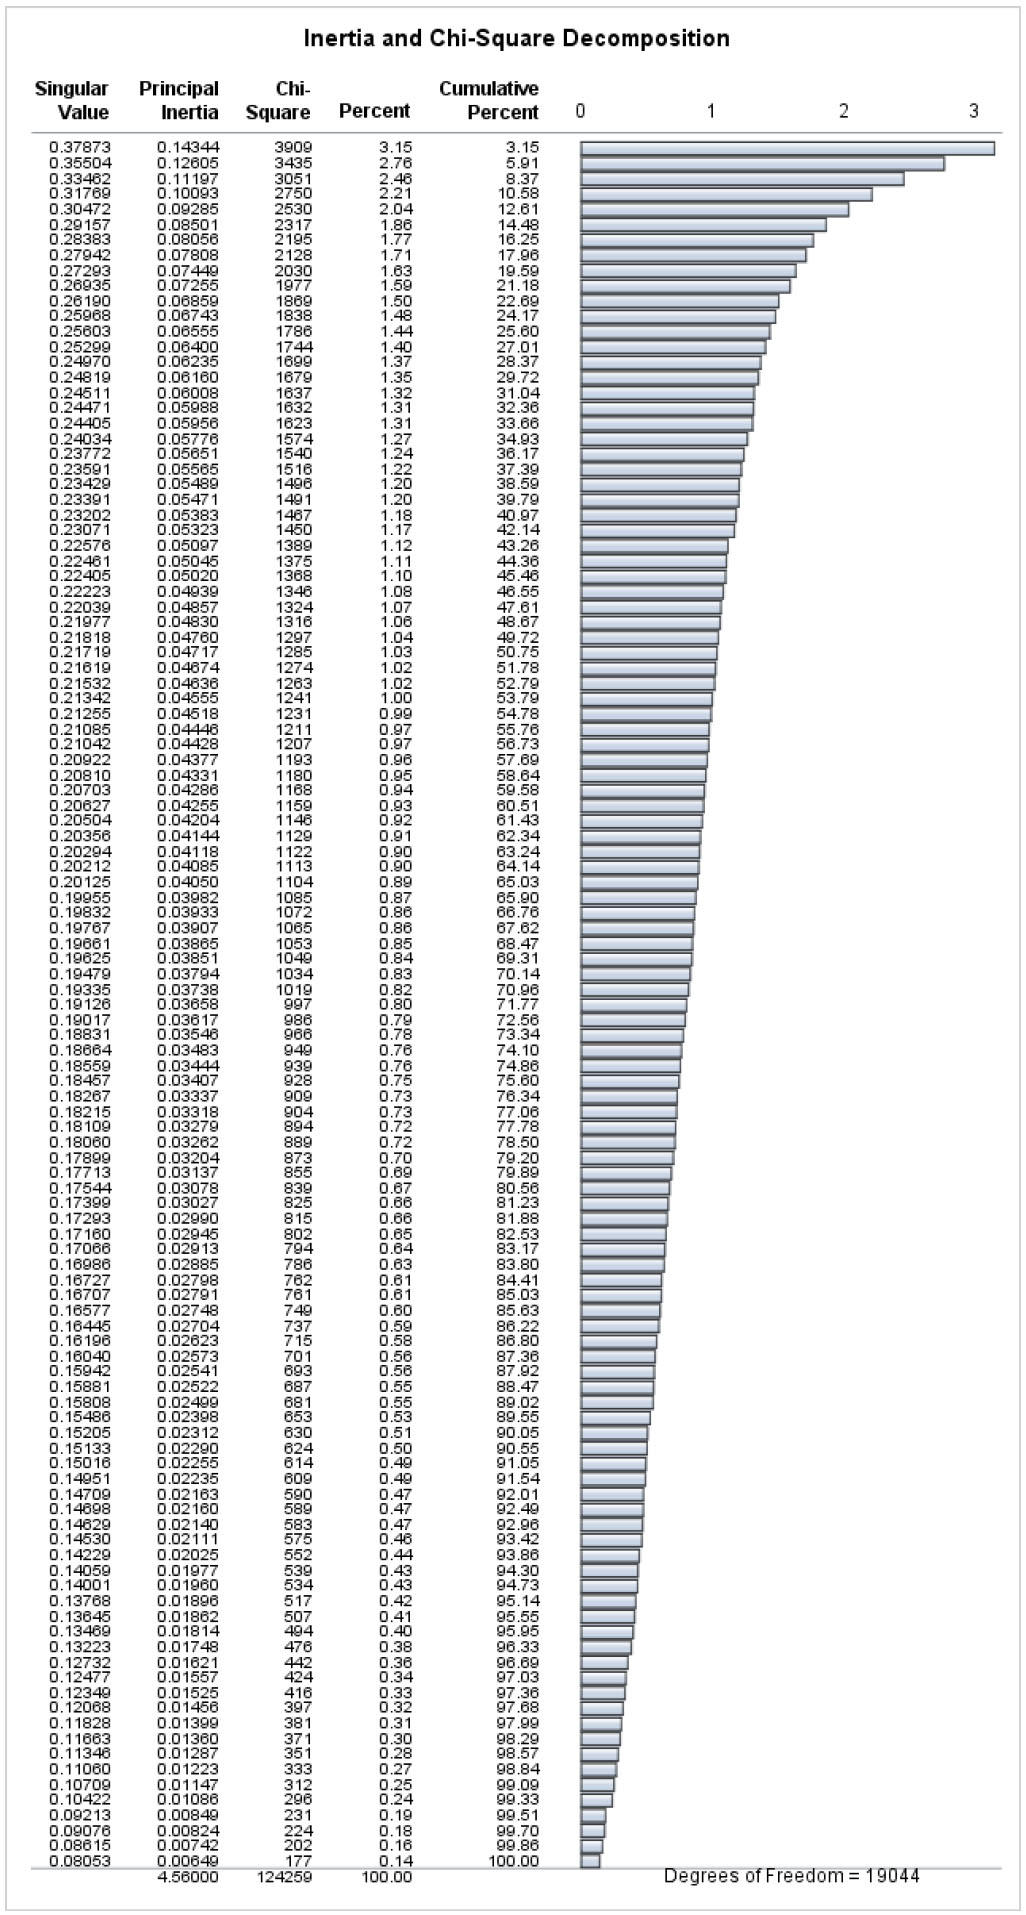
Fig. (5) gives inertia and Chi-Square decomposition for MCA for respondent income distribution and socio-demographic variables. The result shows chi-square distances to analyze the difference among the frequencies of a contingency table in each cell. The explanation of the chi-square distances is cell-independent. As a result, there is a difference between observed values and expected values between pairs of cells. Fig. (2) recommended that the thirty-four dimensions explain 50.75% of the total association. Fig. (5) shows the total chi-square statistic. This analysis analyzes the relation among the rows and columns in all table dimensions (124259 with degrees of freedom of 19044). This chi-square signifies the associations among the factors.
The singular value, which specifies the absolute input of each dimension to clarify the inertia, or proportion of difference, in the participant and variable profiles, is represented in Fig. (5). There is a correlation among the rows and columns of the contingency table, which explains the singular values. Like principal components analysis, the first dimension clarifies the highest variations, the second dimension is orthogonal to the first and shows the remaining variation, and so on.
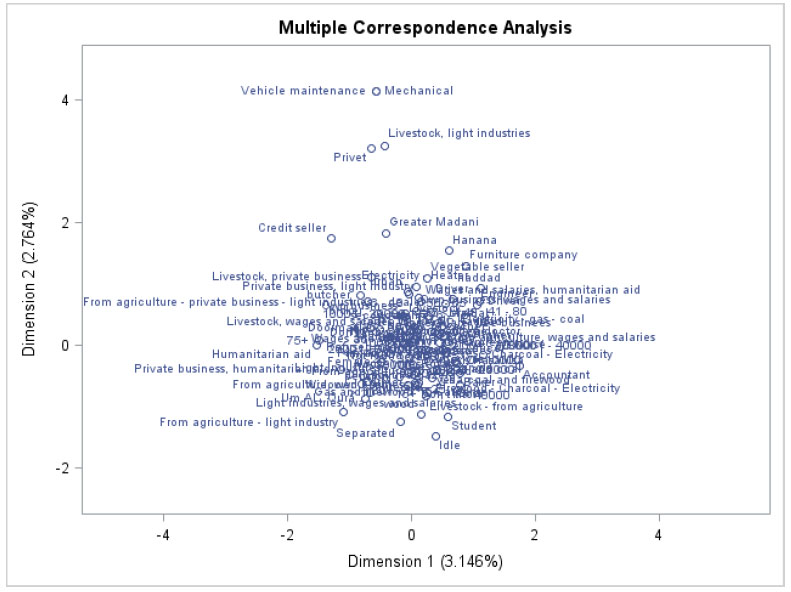
In Fig. (6), dimension 1 is displayed on the horizontal axis, and dimension 2 is displayed on the vertical axis, representing the MCA scaling solution coordinates. In Euclidean space, all categories can be located using multiple correspondence analysis. A study of associations between categories is conducted in the first two dimensions of this space. Dimension 1 represents 3.15 percent of the variance in the data, and dimension 2 represents 2.76% of the variance. Type of occupation (Vehicle Maintenance and Mechanic) appeared separated from the group. The figure indicates that the rest of the variables are related and impact the COVID-19 pandemic. Hence, these variables must be involved in explaining dimension 1.
4. DISCUSSION
The method of multiple correspondence analysis was adapted to illustrate and interpret the economic and social impact of the COVID-19 pandemic in Al Jazeera State, Sudan. By analyzing multiple correspondences, we can further understand how socioeconomic, demographic, and geographic variables impact the COVID-19 pandemic conceptually.
In the discussion above, multiple correspondence analysis explored associations between categorical variables. Based on the contingency table of the columns and rows, multiple correspondence analysis is explained by a method to break down values of the goodness-of-fit statistic. The method can also be used to assign orders to unordered categories. Consequently, the MCA method includes designing a multidimensional space structured on Euclidean distances between points with related masses. Additionally, the presentation is also intended to reconstruct the original data. Coordinate positions show the association among the row and column points.
MCA was used to show the relationship between coded variables and their relations. Using this method, the relationships between variables can be analyzed at various levels of a variable. Besides, the outcome of the analysis is shown analytically and visually. The technique of presentation shows full evidence of the association among variables and associated relations. Consequently, the result from MCA displays the association among the socioeconomic and demographic variables of the COVID-19 pandemic. Furthermore, there is a suggestion that socioeconomic, demographic, and geographic variables have combined effects on the COVID-19 pandemic.
Everyone in Sudan, both urban and rural, appears to be aware of the COVID-19 pandemic, based on the respondents' knowledge and awareness. Likewise, news of the lockdowns and other measures to stop the COVID-19 virus from spreading reached both urban and rural populations. This finding suggests that residents of both rural and urban locations are aware of the lockdowns and limitations related to the coronavirus. Some ailments, like diabetes in rural areas and pressure and diabetes in urban areas, are present among the study participants. People who have both diabetes and high blood pressure in addition to a coronavirus infection may find their health more difficult as a result of this circumstance. Regarding the government’s responsibility, some respondents reported that the government is not honest, while some reported that it is honest and serious to some extent. Regarding the cancellation of participation in social gatherings due to the coronavirus, everyone in urban and rural areas agreed to cancel the gathering. Likewise, a considerable number in urban and rural areas believe that handshakes should be avoided to prevent the spread of the coronavirus.
Regarding social distancing, a considerable number of respondents in urban and rural areas believe that social distancing is effective in limiting the spread of the coronavirus. Regarding the cancellation of participation in social gatherings due to coronavirus, everyone in urban and rural areas agreed to cancel the gathering. Likewise, a considerable number in urban and rural areas believe that handshakes should be avoided to prevent the spread of the coronavirus. This result indicates that the study sample members have knowledge and awareness of the ways of spreading coronavirus. Regarding social distancing, some respondents in urban and rural areas believe that social distancing is effective in limiting the spread of the coronavirus because social activities are varied and spread in urban and rural areas of Sudan.
Regarding the income distribution to respondents, the results showed that those living in rural areas work in more than one job, and more than one person works in the family. This situation is prevalent in most of the states of Sudan because the economic circumstances prompted many of them to work to help their families improve their economic and living conditions.
CONCLUSION
The COVID-19 pandemic has significantly affected the economy and society of Gezira State, Sudan. It has disrupted various economic sectors, leading to job losses, income reductions, and increased poverty. The healthcare system has been strained, and social distancing measures have impacted social interactions and community activities.
The pandemic has caused decreased production, disrupted supply chains, and reduced consumer spending, leading to unemployment and financial hardships. It has also affected education and mental health, highlighting existing social inequalities.
Efforts to address the impact of the pandemic have included government interventions, community support initiatives, and vaccination campaigns. Policymakers and organizations must continue addressing the pandemic's long-term economic and social implications through targeted interventions and sustainable development initiatives. The COVID-19 pandemic has had a significant impact on education and mental health worldwide. Schools and universities had to shift to remote learning, causing disruptions in traditional education methods. This transition highlighted the digital divide, with some students lacking access to necessary technology or struggling with remote learning. Moreover, the pandemic has taken a toll on mental health, with increased stress, anxiety, and isolation affecting many individuals, including students and educators. The uncertainties surrounding the virus, social distancing measures, and changes in daily routines have contributed to a rise in mental health issues. Addressing these challenges requires a holistic approach that includes providing support for remote learning, promoting mental health awareness, and offering resources for those in need. Communities and institutions need to prioritize mental health support and ensure that students and educators have access to the resources they need during these challenging times.
The study faces limitations like data availability and quality, the intricacy of factors, uncertainty, rapid changes, regional variations, behavioral shifts, long-term impacts, and limited historical comparisons. Given these limitations, it is crucial for future researchers to carefully approach the economic and social implications of the COVID-19 pandemic, acknowledging the uncertainties that come with it.
LIST OF ABBREVIATIONS
| WHO | = World Health Organization |
| CA | = Correspondence Analysis |
| OLS | = Ordinary Least Square |
ETHICS APPROVAL AND CONSENT TO PARTICIPATE
Ethical approval was obtained from the Gezira University Review Board (approval number 2023/02 /25103). The research team followed the ethical guidelines set by the Sudan National Committee of Bioethics (SCBE) and the Research Policies & Procedures of Gezira University, and confidentiality was ensured by not collecting any identifying data. The research team only had access to the survey responses.
HUMAN AND ANIMAL RIGHTS
No animals were used in this research. All procedures performed in studies involving human participants were in accordance with the ethical standards of institutional and/or research committees and with the 1975 Declaration of Helsinki, as revised in 2013.
AVAILABILITY OF DATA AND MATERIALS
The data and supportive information will be provided upon request by corresponding author [M.M].