All published articles of this journal are available on ScienceDirect.

Impact of Weather on Incidence and Mortality of COVID-19: An Application of the ARIMAX Model
Authors Info & Affiliations
Abstract
Introduction
SARS-CoV-2 is primarily transmitted by direct contact between infected individuals, but other factors, such as meteorology, can affect mortality rates and the incidence of this disease. The purpose of this study was to examine the impact of meteorological factors on COVID-19 incidence and mortality in a center of Iran. In fact, this study sought to pursue two main goals: first, to find climate and air pollutant risk factors that seem to be related to people's respiratory conditions, and their effect on the number of daily cases and deaths caused by COVID-19, and the second one was to use the time series regression model as the appropriate model for such data instead of one-variable models.
Material and Methods
Data collected over time can be modeled and forecasted using time series methods. It is common for time series models to be based on a single response variable, such as the Autoregressive Integrated Moving Average (ARIMA) model. In addition to the number of deaths and confirmed cases of COVID-19 as the response variable, we have also considered meteorological indices as independent variables. ARIMAX time series method was applied in this case.
Results
The ARIMAX model was fitted in five lags (lag time in days). It was found that the average daily temperature in lag 10 and relative humidity in lag 7 were related to the mortality caused by COVID-19. The average visibility also had a significant and inverse relationship with the number of deaths in lag 14 and 7; this relationship was also observed with the number of confirmed cases, so in lag 3, as average visibility decreased, the number of cases increased.
Conclusion
It seems that some factors, such as temperature and severe storms, can affect the severity of the disease and should be considered in such conditions, especially for heart and respiratory patients. Thus, the necessary measures should be taken to reduce the severity of the infection with COVID-19 and the deaths caused by it.
1. INTRODUCTION
COVID-19 is a respiratory disease caused by Coronavirus 2 (SARS-CoV-2) and human acute respiratory syndrome, which started in Wuhan, China, in December 2019. Due to high transmissibility, the disease spread rapidly worldwide, so from December 2019 to April 10, 2020, nearly 1.5 million confirmed cases in 184 countries and more than 92,000 deaths have been reported around the world. It was thus announced as a global pandemic on March 11, 2020, by the World Health Organization (WHO) [1-3].
Although this virus is mainly transmitted through direct contact between infected people and others, there are still unknown factors that may have an impact on its survival and transmission [4]. The transmission of this virus can be influenced by several factors, including meteorological factors. Therefore, investigating the impact of weather conditions on the transmission of COVID-19 and the increase in infected cases and deaths caused by it seems necessary [1, 5].
Several studies have shown weather parameters, such as temperature, rainfall, humidity, wind speed, and air pollutants, to affect the transmission of COVID-19 [6-9]. A significant relationship between temperature and transmission of COVID-19 has been reported in some countries, such as China, Indonesia, and Italy [6, 10, 11], while nothing has been reported from 144 countries around the world [9]. Also, in some studies, it has been shown that humidity, as an important weather parameter, can significantly reduce the transmission of COVID-19, but some studies have not reported any significant effect [2, 12].
Also, Ahmadi et al. and Sobral et al. investigated the effect of rainfall, air pollutants, and wind speed on the spread of COVID-19 and found rainfall and air pollutants to have a positive effect, while wind speed to have a significant negative effect on COVID-19 [7, 13].
The effect of weather parameters, including rainfall, PM2.5, maximum wind speed, minimum and maximum temperature, and surface pressure in South Asian countries was investigated using the ARIMAX model by Sabir Hossein et al., and it was shown that maximum wind speed, rainfall, PM2.5, and temperature are four variables that can play a vital role in the transmission of COVID-19; the maximum wind speed was reported to have a negative effect on the transmission of COVID-19 in India and Sri Lanka and rainfall in India [1]. Also, besides India, temperature was reported to have different effects (positive or negative) on the transmission of COVID-19 in four South Asian countries (Afghanistan, Bangladesh, Pakistan, and Sri Lanka) [1]. For example, the maximum temperature was reported to have a negative effect on it in Bangladesh, while a positive one in Afghanistan.
Studies conducted in Thailand, Singapore, India, and China have also reported a positive relationship between temperature and the daily number of COVID-19 cases [14-17]. However, several studies have found a negative association between them. For example, Wu et al. showed increasing temperature to be associated with a decrease in new daily COVID-19 cases in Brazil and Canada, and also reported a negative relationship between relative humidity and new daily COVID-19 cases [2]. Other variables, such as absolute humidity and wind speed, have been reported to have a positive relationship with the number of COVID-19 cases in many countries, including Thailand and Turkey [18].
In a study by Altamimi et al., in which climatic factors and their relationship with the spread of the MERS-CoV virus in the region of Saudi Arabia were investigated, it was shown that high temperature, low wind speed, and low relative humidity have an impact on the increase of MERS-CoV cases [19].
Meanwhile, the prevalence of SARS was reported to be significantly related to temperature, and the daily incidence rate increased at lower temperatures in a study conducted in four major cities of China [20].
In another study conducted by Tobias et al. in Barcelona, the incidence rate of COVID-19 decreased by 7.5% on average, while the air temperature increased by one degree Celsius on the same day (zero-time delay) [21].
Xie and Zhu reported an increase of 4.86% in daily confirmed cases with an increase of one degree Celsius in air temperature in a study conducted in 2020 [21]. Ma et al. also reported a positive relationship between COVID-19 daily mortality and daily temperature range and a negative relationship with respect to relative humidity [22]; however, Yao et al. did not confirm the relationship between temperature and the transmission of this virus in their study conducted in major cities of China [23].
In a study conducted in Bojnord (a city in Iran), air temperature was not shown to have a significant effect on the transmission of COVID-19, but the relative risk of transmission was reported to be greater than that in most of the considered lag times [4].
According to the mentioned studies, there is no consensus on the impact of meteorological factors on the transmission of COVID-19 and the increase in daily positive cases and deaths caused by it. Therefore, according to the existing uncertainties regarding this matter, it can be said that more investigations should be conducted in different regions considering different weather conditions.
Different methods have been used for data analysis in every mentioned study. Several statistical methods, such as regression, generalized additive model, and generalized linear model have been used to determine the effect of environmental factors on the transmission of this disease [24].
In general, for data that is collected over time and is of a time series type, the ARIMA model is used more than other models to predict future values. However, the problem with this model is that only one variable is examined, while other variables that are also dependent on time may affect the prediction; therefore the time series regression model, ARIMAX, is suggested.
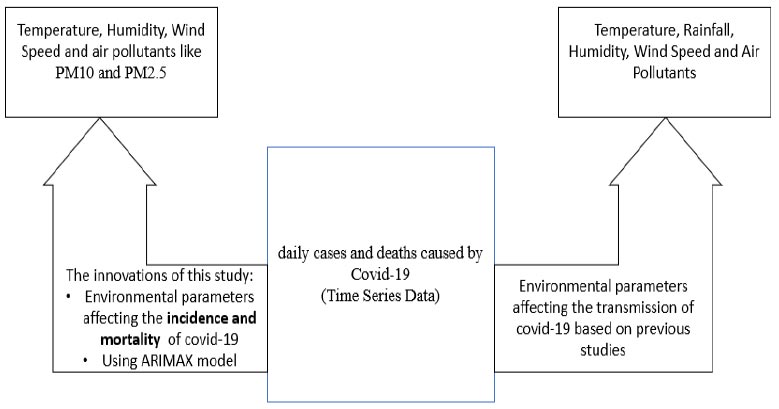
The whole idea of this study.
Regression models are used for time series data mostly. Although the stationary process is one of the preconditions in the implementation of any regression technique on time series data, it is not investigated in such models. Therefore, the estimates obtained from these studies may be incorrect. Therefore, one of the methods used in dealing with such data is the ARIMAX model [25]. As a result, the estimates obtained in these studies may be incorrect, and a model, like ARIMAX, should be used for dealing with such data.
Therefore, in this study, we used the ARIMAX method to analyze and investigate the relationship between weather variables and the number of positive cases of COVID-19 and the number of deaths caused by it.
This study had two main goals; the first one was to investigate the effect of environmental and meteorological factors on mortality and the number of daily cases of COVID-19. Previous studies have determined the effect of these risk factors on the transmission of COVID-19. The second goal was to use the time series regression model (ARIMAX), considering that explanatory variables and dependent variables are both measured over time and are time series data. Fig. (1) shows the general idea of this study and its difference with respect to the results of previous studies.
2. METHODS
In recent decades, the use of forecasting models has expanded, especially for time series data. A time series is a set of observations for a random variable arranged by time, and the overall goal of time series analysis is to create and define the model and predict future values [26].
In a time series analysis, the probable model is identified by examining the past behavior of the series, and then assuming that the data will have a similar one in the future and follow the fitted model; in this way, the future values of the series are predicted. This analysis is usually performed on data that are not independent and sequentially dependent. This dependency between consecutive observations is very important and mostly used in forecasting [27].
Two goals are usually pursued during time series analysis: understanding or modeling the random mechanism that leads to the observation of the series and predicting the future values of the series based on past ones.
Classical time series models are divided into two types: stationary and non-stationary series. In a stationary series, the mean, variance, and autocorrelation are constant over time, and this assumption must be held while using models, such as Autoregressive (AR), Moving Average (MA), and Autoregressive Moving Average (ARMA) [27, 28].
To check data on stationary time series, first, the time series graph is provided and then the presence or absence of trends, seasonal components, and outlier observations are determined. If a non-stationary time series is observed according to this graph, it is necessary to consider transformations, such as Box-Cox transformation and differences in the data.
One of the common models for dealing with non-stationary data is the Autoregressive Integrated Moving Average (ARIMA) model. The general form of the ARIMA (p, d, q) model is as follows:
yt = θ 0 + Øyt-1 + Ø2yt-2 + .... + Øpyt-p + εt - θ1εt-1- θ2εt-2 - ... - θqεt-q
Where, p is the partial autocorrelation component determined based on the Partial Autocorrelation Function (PACF). d shows the order of difference and q is the moving average component obtained according to the Autocorrelation Function (ACF). yt and εt show the actual value of observations and random error at time t, respectively [28].
As it is clear in the above relationship, only observations related to one variable are used to predict the future values in the ARIMA model, and observations related to other variables that may affect the time series are ignored. Time series regression models are more suitable for such situations in which time series Y is predicted considering that it has a linear relationship with time series X. In other words, both past values of the variable Y and the time series values of X are effective while predicting the future values of Y.
The most common method used for time series analysis is the ARIMA model, and if independent variables that may be related to the response variable are added to the model, the model is called ARIMAX. The general form of this model is as follows:
yt + α1yt-1 + ... + αpyt-p = θ1x1t + ... + θqxqt + εt
Where, Xts are independent variables collected over time [29].
2.1. Dataset
This study was a cross-sectional study and the data used in this study included the number of registered confirmed cases of COVID-19 and the number of daily deaths caused by it from January 22, 2020, to January 8, 2022, in the Yazd province (Fig. 2) as response variables and the data related to independent variables obtained from en.tutiempo.net, including the daily weather information on the mentioned dates and it is available at en.tutiempo.net. R software version 4.2.0 and “TSA” and “lmtest” packages were used to analyze the results.
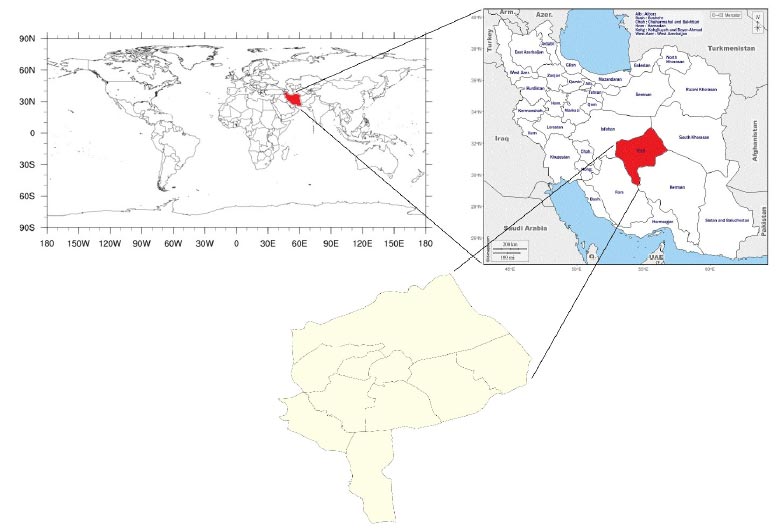
Location of the study area in Yazd province, Iran.
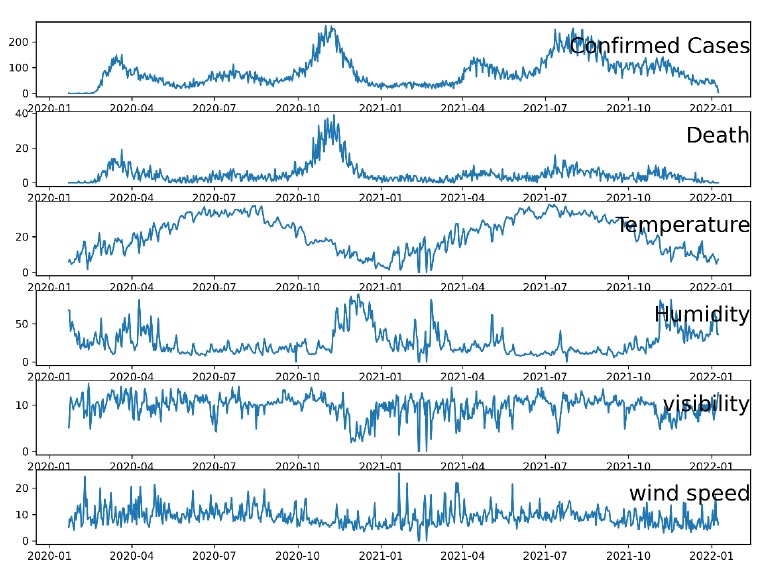
Time series plot for study variables.
3. RESULTS
First, the time series graph was drawn for all variables, as shown in Fig. (3).
Knowing that meteorological indicators may affect the mortality and morbidity of COVID-19 patients with a time delay, lags of 0, 3, 7, 10, and 14 were considered and the ARIMAX model was fitted. A loop with different values for p, q, and d parameters was launched and the model with the lowest MSE value was selected as the best one. Confirmed cases of COVID-19 and the daily number of deaths due to it were considered as the response variables, and average daily temperature, maximum daily temperature, minimum daily temperature, relative humidity, average visibility, and average wind speed were considered independent variables.
The best models were determined for each time lag based on the MSE; the results are provided in Tables 1-3.
The best-fitted model for each lag was identified (Table 1), and then the coefficients of the regression model were determined for each one. As can be seen in Table 2, the average daily temperature has a significant association with the daily number of deaths due to COVID-19 in lag 10 (p-value=0.017) and according to the coefficient of this variable, the relationship is such that its average increases as the average temperature increases.
Also, relative humidity has been found to be inversely associated with the daily number of deaths due to COVID-19 in lag 7 (p-value=0.027).
Moreover, the average visibility exhibited a significant and inverse association with the daily number of deaths due to COVID-19 in lags 7 and 14. On the other hand, it is known that the average visibility is related to storms in this province, so as a matter of fact, it has a significant association with strong storms. The greater the horizontal visibility, the lower the intensity of dust pollution and the decreased the daily number of deaths due to COVID-19 in lags 7 and 14. According to Table 3, there is a relationship between visibility and the daily number of COVID-19 confirmed cases (p-value=0.033), so alongside decreasing visibility, the daily number of infected cases increased in lag 3, and also the intensity of storms and dust has increased.
| Response Variable | Lag | Model | MSE | AIC |
|---|---|---|---|---|
| Confirmed cases | 0 | ARIMAX (6,2,5) | 263.327 | 6062.487 |
| 3 | ARIMAX (6,2,5) | 261.989 | 6034.08 | |
| 7 | ARIMAX (6,2,5) | 266.443 | 5956.49 | |
| 10 | ARIMAX (6,2,5) | 266.242 | 5986.03 | |
| 14 | ARIMAX (6,2,5) | 267.919 | 5956.49 | |
| Deaths | 0 | ARIMAX (3,1,4) | 6.376 | 3387.99 |
| 3 | ARIMAX (5,2,6) | 6.295 | 3373.76 | |
| 7 | ARIMAX (5,2,6) | 6.328 | 3358.34 | |
| 10 | ARIMAX (5,2,6) | 6.328 | 3345.24 | |
| 14 | ARIMAX (5,2,6) | 6.361 | 3332.01 |
| - | Lag | Coefficient | SE | Z | p-value |
|---|---|---|---|---|---|
| Average temperature | 0 | -0.004 | 0.030 | -0.132 | 0.894 |
| (C°) | 3 | -0.054 | 0.029 | -1.879 | 0.060 |
| 7 | -0.003 | 0.028 | 0.125 | 0.899 | |
| 10 | 0.072 | 0.030 | 2.372 | 0.017 | |
| 14 | -0.017 | 0.031 | -0.572 | 0.567 | |
| Average relative humidity (%) | 0 | 0.002 | 0.009 | 0.253 | 0.799 |
| 3 | -0.007 | 0.009 | -0.823 | 0.410 | |
| 7 | -0.019 | 0.008 | -2.206 | 0.027 | |
| 10 | 0.009 | 0.009 | 0.984 | 0.324 | |
| 14 | 0.007 | 0.008 | 0.827 | 0.407 | |
| Average visibility (Km) | 0 | 0.048 | 0.048 | 0.987 | 0.323 |
| 3 | 0.018 | 0.046 | 0.387 | 0.698 | |
| 7 | -0.051 | 0.022 | -2.337 | 0.019 | |
| 10 | -0.006 | 0.060 | -0.102 | 0.918 | |
| 14 | -0.079 | 0.029 | 2.668 | 0.007 | |
| Average wind speed (Km/h) | 0 | -0.007 | 0.028 | -0.023 | 0.981 |
| 3 | 0.012 | 0.028 | 0.445 | 0.659 | |
| 7 | -0.001 | 0.029 | -0.037 | 0.969 | |
| 10 | -0.013 | 0.032 | -0.415 | 0.677 | |
| 14 | 0.035 | 0.028 | 1.25 | 0.211 |
| - | Lag | Coefficient | SE | Z | p-value |
|---|---|---|---|---|---|
| Average temperature | 0 | 0.136 | 0.220 | 0.618 | 0.536 |
| 3 | 0.266 | 0.218 | 1.219 | 0.222 | |
| 7 | -0.113 | 0.224 | -0.505 | 0.613 | |
| 10 | 0.203 | 0.227 | 0.896 | 0.369 | |
| 14 | -0.247 | 0.226 | -1.092 | 0.274 | |
| Average relative humidity | 0 | 0.009 | 0.065 | 0.141 | 0.887 |
| 3 | -0.077 | 0.064 | -1.186 | 0.235 | |
| 7 | -0.028 | 0.066 | -0.42 | 0.673 | |
| 10 | 0.001 | 0.066 | 0.026 | 0.979 | |
| 14 | 0.005 | 0.066 | 0.077 | 0.938 | |
| Average visibility | 0 | 0.326 | 0.318 | 1.024 | 0.305 |
| 3 | -0.673 | 0.315 | -2.131 | 0.033 | |
| 7 | 0.126 | 0.325 | 0.387 | 0.698 | |
| 10 | 0.356 | 0.326 | 1.092 | 0.274 | |
| 14 | 0.256 | 0.326 | 0.784 | 0.432 | |
| Average wind speed | 0 | -0.077 | 0.177 | -0.437 | 0.661 |
| 3 | -0.303 | 0.173 | -1.745 | 0.080 | |
| 7 | 0.08 | 0.180 | 0.446 | 0.655 | |
| 10 | -0.045 | 0.178 | -0.255 | 0.798 | |
| 14 | -0.049 | 0.178 | -0.278 | 0.780 |
4. DISCUSSION
COVID-19 in Iran was officially reported on February 17, 2021, and the first death caused by it was identified in Qom, a holy city in the center of Iran. After a short time, the disease spread widely in other provinces [30]. Meanwhile, the provinces of Semnan, Qom, Yazd, Markazi, and Qazvin experienced critical conditions rather than the others considering the corrected cumulative frequency of patients according to the population of the province. Therefore, Yazd province was among the provinces with a high prevalence of COVID-19 in Iran [31]. In addition, due to dusty storms and high temperatures on many days of the year, this province has special weather conditions compared to the others. In this study, we have investigated the relationship between meteorological variables and the incidence of COVID-19 and deaths caused by it.
The relationship between meteorological indicators and air pollution with respect to the transmission and incidence of COVID-19, influenza, and MERS has been investigated in various studies conducted in different places of the world. In many of them, temperature has been one of the significant indicators having an inverse relationship with the number of new cases, so an increase in temperature can be considered to reduce the probability of incidence as well as decrease the number of deaths. This negative relationship between temperature and the daily number of COVID-19 confirmed cases was also observed in a study conducted in several Chinese cities having a high incidence, so at temperatures below -3°C, the cumulative relative risk of incidence increased and then decreased [32]. However, this relationship has not been found to be inverse in all studies. For example, a direct significant association between temperature and the number of deaths due to COVID-19 was reported in a study conducted in the city of Qom in Iran; an increase in temperature with a delay of one or two days has caused an increase in mortality [30]. In our study, a similar result was observed in the city of Yazd; the increase in temperature in lag 10 was directly related to the increase in number of deaths due to COVID-19, but it was not significant in other lags. Knowing that Yazd is one of the cities with mostly hot weather, and dusty and stormy on some days, making it difficult to breath, it seems that the temperature conditions can affect the number of deaths due to COVID-19 with a delay of several days. On the other hand, the average visibility demonstrated a significant three-day time lag relationship with the incidence of COVID-19, and this was also observed for the number of deaths due to COVID-19 in lag 7 and 14.
Also, many studies have pointed out the importance of PM10, an index to determine the particulate matter in the air; some have said that this index has the highest effect on the severity of this disease as well as deaths occurring due to it with respect to age. It has been reported that an increase in the value of PM10 causes a 3.06% increase in the COVID-19 infection severity and a 2.68% increase in deaths caused by it [33].
Moreover, the results of a study conducted in Seoul demonstrated the PM2.5 index to have a direct significant relationship in lag 7 with COVID-19 confirmed cases. In another study conducted in China, it was shown that exposure to higher levels of PM2.5 made people more prone to die from COVID-19 with a delay of more than 18 days (lag 18) [34]. The results of this study were somehow similar, considering average visibility to be one of the variables having a significant inverse relationship with both the daily number of COVID-19 confirmed cases and deaths due to it.
Considering that storms and dust are observed in Yazd province on many days of the year, especially in the hot season, it appears that dust and storm intensity in the air decreases average visibility in this province, and as a result, increases PM10 and PM2.5. So, the inverse relationship between average visibility and confirmed cases of COVID-19 and deaths may somehow be expressing the direct relationship between PM10 and PM2.5 and COVID-19 confirmed cases and deaths. Since the data containing PM10 and PM2.5 indicators were inaccessible, average visibility was used instead.
CONCLUSION
It is evident that special attention should be paid to the air quality indicators, especially in times of dealing with respiratory diseases, such as COVID-19, and the focus should be on determining and applying policies, regulations, and guidelines by health institutions in all areas, especially areas with higher pollution and higher concentrations of PM10 and PM2.5. This can help reduce confirmed cases and deaths caused by respiratory diseases, especially COVID-19. This could be particularly important and helpful for patients suffering from other respiratory diseases or heart diseases, of those at increased risk.
AUTHORS’ CONTRIBUTION
All the authors have accepted responsibility for the manuscript's content and consented to its submission. All of them have meticulously reviewed the results and unanimously approved the final version of the manuscript.
LIST OF ABBREVIATIONS
| PM10 | = Particles with a diameter of 10 micrometers or less |
| PM2.5 | = Particles that are 2.5 microns or less in diameter |
| MERS-CoV | = Middle East Respiratory Syndrome Coronavirus |
| MSE | = Mean squared error |
| AIC | = Akaike information criterion |
ETHICAL STATEMENT
This study did not include human subjects, and after the approval of the ethics committee of Shahid Sadoughi University of Medical Sciences Yazd, Iran (ethical code: IR.SSU.SPH.REC.1401.094), registered cases were used.