All published articles of this journal are available on ScienceDirect.

Spatial Analysis of the Cholera Epidemic: Outbreak and Death
Authors Info & Affiliations
Abstract
Background
Cholera is a global threat that occurs as a result of weak public health. The aim of the data re-analysis study was spatial modeling of cholera outbreak and mortality.
Methods
Data on the outbreak and mortality of cholera was obtained from the website of the World Health Organization. The database was created using ArcGIS software and statistical tests and related maps were extracted. Getis-Ord-Gi statistic was used for this purpose during the years 2000-2021.
Results
The hot spots in 2000 were mainly found in Africa, and during the years 2010-2013 were shifted to the American continent (Haiti), and the cold spots were concentrated in European countries (Getis-Ord-Gi / Sig = 90%, 95%, 99%). In total, the cholera deaths were 81241 which constituted to be as follows: Africa 80.64%, America 12.48%, Asia 6.68% and Oceania 0.18%. One death was reported in Europe. The maximum deaths were reported in 2010 (7826) and minimum in 2020 (839). In recent years, the trend of cholera outbreaks and deaths has been declining over the last 10 years.
Conclusion
According to WHO, continuous reporting is required in developing countries for correct strategy. This study allows health planners and managers to visually assess, inform, and quickly identify cholera-related death centers using geographical information system (GIS) software.
1. INTRODUCTION
Cholera is an acute bacterial bowel disease whose symptoms begin suddenly with occasional runny, watery, painless, and vomiting. Untreated cases lead to rapid dehydration, acidosis, circulatory system collapse, pediatric hypoglycemia, and renal failure, and eventually death [1].
The agent of the disease is a curved gram-negative bacillus of the Vibrionaceae with common features with Entero bacteriaceae. The serogroups, O1 and O139, are the cause of the cholera disease, but serogroup O1 is the main cause. El Tor biotype is responsible for current epidemics in the world [2] infecting large number of people in developing countries declaringcholera a global threat. Cholera has historically caused devastating epidemics. Various studies have been performed, and it remains a major national health problem in Africa, Asia and Latin America. The cholera occurs mainly in countries with weak health system but is also sporadic in developed countries [3]. The two main characteristics of this disease are its tendency for sudden outbreaks and its ability to be a pandemic.
Cholera is one of the first diseases on which epidemiological studies have been carried out and its relationship with drinking water has been proven, and health programs aimed at providing safe drinking water can be derived from these studies every year [4]. An infected person can shed the bacteria for months or even years, contaminating water sources and remaining endemic in the region. The vibrio cholerae can survive in food for up to 14 days but are destroyed by heating the food [5].
Contamination may be caused by eating contaminated seafood, raw fish, and oysters, or contaminated fruits and vegetables. Person-to-person transmission is rare. Usually epidemic occurs in the summer [6]. It is important to note that the correct number of cholera cases is low due to the weakness of the care system, the fear of its consequences and the decline in tourism. For this reason, today, cholera is a key indicator of the lack of socio-economic development. As soon as the cholera epidemic begins, infected patients excrete large amounts of Vibrio cholerae through waterways or human transmission between susceptible and infected individuals [7].
While numerous studies have studied cholera mortality [8-10], spatial studies remain scarce. Therefore, being aware of the changes in the hotspots of disease worldwide can play an effective role in the future of health planning. Therefore, this study was conducted with the aim of spatial modeling of cholera-related outbreaks and mortality among 117 countries with the help of geographical information system (GIS) software. One of the features of GIS is the ability to understand geographical patterns in space and time. GIS is a powerful resource for community health; its ability to integrate data from different sources to generate new information and applications of intrinsic visualization can have lasting effects on people's health.
2. METHODS
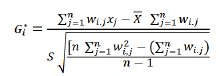
In this analytical study, using data reanalysis method, the latest statistics of outbreaks and deaths of cholera were reported by the World Health Organization (WHO) consisting of the data of 117 countries (2000- 2021). The available data was provided to the WHO by the Ministries of Health of various countries. The data was categorized based on country, continent, cholera outbreak and mortality, and water supply improvement. Among the challenges in this regard were the incompleteness of data and the lack of coordination in the provision of data by countries. Some countries, especially Africa and Asia, did not report data on cholera mortality and outbreaks and the improvement of water resources. The limitations of this study were the use of secondary data, which made it impossible for researchers to assess the quality of the data. There were also differences in the methods of collecting data and estimating the number of deaths in countries, which were beyond the control of the researchers. In this study, due to the lack of access to specific indicators such as water pollution, rainfall, etc., the researchers were unable to measure the effects of these indicators on cholera deaths. The ArcMAP of ArcGIS (ESRI, v. 9.2) Software was used for spatial modeling. For this purpose, according to Almasi et al. (2021) [11], a database was first created in the ArcCatalog software environment, and then spatial tests and related maps were extracted in ArcMap software. For spatial analysis, Getis-Ord-Gi statistics were used to detect the spatial distribution of hot spots (high spatial clusters) and cold spots (low spatial clusters). Statistic Getis-Ord-Gi is calculated as follows (Eqs. 1-3):
 |
(1) |
 |
(2) |
 |
(3) |
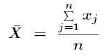
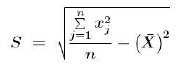
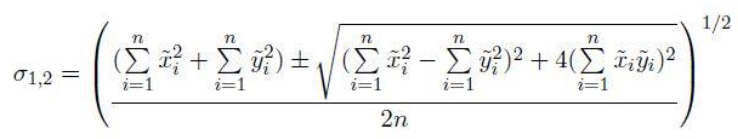
Where, Xj is the feature value for j; Wij is the spatial weight between the feature and i, j; n total number of features. The value of this statistic is between ±1, ±2 and ±3 with confidence levels of 90%, 95% and 99%. To survey the trend of disease, the standard ellipse or spatial standard deviation was used (Eqs. 4, 5):
 |
(4) |
 |
(5) |
Where, xi and yi are the coordinates of feature I, { } is the central mean of the features and n is the total number of features in the analyzed layer, respectively. After calculating the mean±standard deviation, points are determined in each direction based on the corresponding standard deviation and these points will be connected.
3. RESULTS
Fig. (1) shows the number and trend of cholera deaths in different countries. Countries marked in red and green had the maximum and minimum deaths, respectively. In general, the maximum deaths were reported in 2010 (7826 cases) and the minimum in 2020 (839 cases) (Fig. 2a). It should be noted that the minimum and maximum cholera outbreaks were in 2021 (6007 cases) and 2017 (1170924 cases), respectively (Fig. 2b). A total of 6589014 cases of cholera outbreak were reported worldwide.
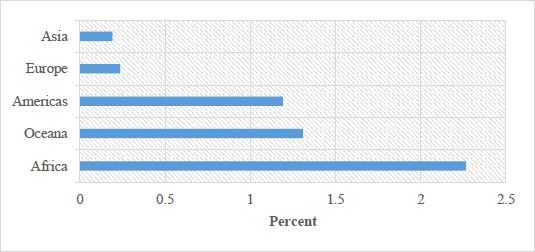
In total, the death rate from cholera was 81241: Africa 80.64%, America 12.48%, Asia 6.68%, and Oceania 0.18%. One death was reported in Europe (Germany,2017). The maximum deaths were reported in 2010 (No.7826) and the minimum in 2020 (No. 839) (Fig. 3).
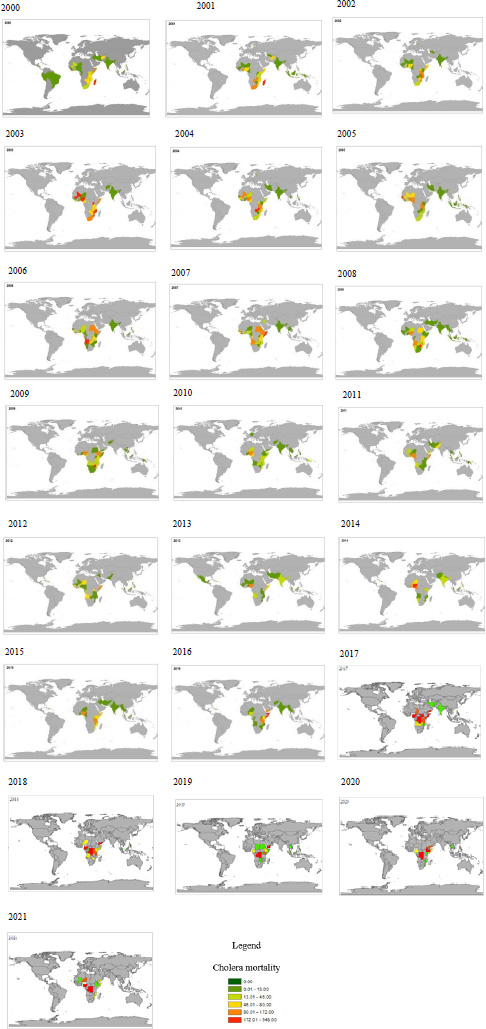
Number and trend of cholera mortality in the worldwide during 2000-2021 (according to WHO data).
Yemen has the highest mortality rate in Asia (No.4256). The maximum death rate in Africa was 13304 cases recorded in the Democratic Republic of the Congo. In the Americas, Haiti accounts for 94.76% of deaths with 9614 cases.
In total, the countries that reported a high rate of death (higher than 1000 cases) included:
Democratic Republic of the Congo 13304, Nigeria 10107, Haiti 9614, Zimbabwe 6290, Somalia 5435, Yemen 4256, Angola 3964, Madagascar 2085, United Republic of Tanzania 2013, Sudan 1692, Ethiopia 1544, Mozambique 1476, Malawi 1381, Zambia 1363, Chad 1319, Uganda 1267, Kenya 1168, and Guinea 1017. The 19 hot spots identified in 2000 were in Africa. In 2021, the number of hot pots were 19, but in Asia (Yemen) were more.
Drinking water safety in Italy, Israel, Luxembourg, Malta, Monaco, Netherlands, Norway, Romania, San Marino, Spain, Sweden, Switzerland, United Kingdom of Great Britain, Northern Ireland, Kuwait, New Zealand, Denmark, Finland, Germany, and Iceland was 100 percent.
According to Fig. (4), the results of the Getis-Ord-Gi test for the identification of hot and cold spots of cholera mortality are given in three confidence levels 90%, 95%, and 99%. An examination of the spatial trend of cholera hotspots showed that the spots were concentrated in Africa in 2000 (Zambia, Zimbabwe, Mozambique, Malawi, Botswana, Tanzania, Rwanda, Borneo, Kenya, Uganda, and parts of Somalia).
It is noteworthy that the hot spots from 2010 onwards in the Americas (Mexico, Venezuela, Colombia, Cuba, Costa Rica, Nicaragua, Costa Rica, Honduras, and Haiti) were formed and continued until 2013. During 2010-2013, hot spots in Africa disappeared. In 2014, hot spots were observed again in large parts of the African continent. Based on the output maps of GIS software, the directions of the spots also changed in 2000, 2001, and 2002, it was northeast-southwest and since 2003, the direction of the centers changed to northwest-southeast. It is noted that cold spots were formed between 2003-2005 in Europe and a small part in Asia.
In total, 51 countries in Africa, 17 countries in the Americas, 32 countries in Asia, 18 countries in Europe, and 4 countries in Oceania have reported their data. Yemen ranks first (2,588,510 cases) in the outbreak of cholera. Haiti ranks second in the Americas (813,972) and Congo ranks third in Africa, which reported 449,236 cases. Total outbreaks were Africa: 2891909 (Max in Congo, 449236), America: 851,729 (Max in Haiti, 813,972), Asia: 2,833,618 (Max in Yemen, 2,588,510), Europe: 423 (Max in England, 271) and Oceania: 11302 (Max in Papua New Guinea, 10954).
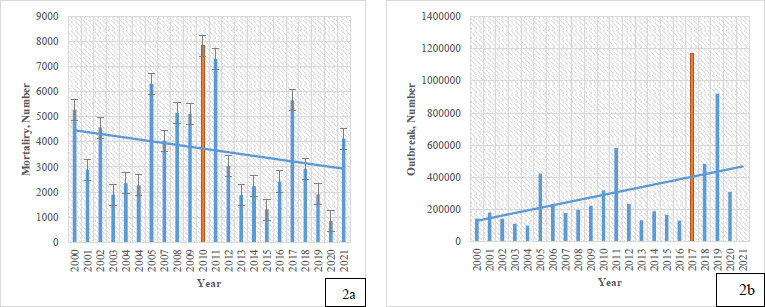
Frequency of cholera mortality (a), cholera outbreak (b) worldwide in 2000-2021.
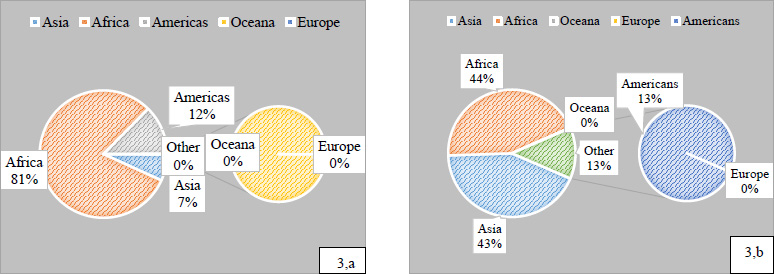
Percent of cholera mortality (a), cholera outbreak (b) in different continents (2000-2021).
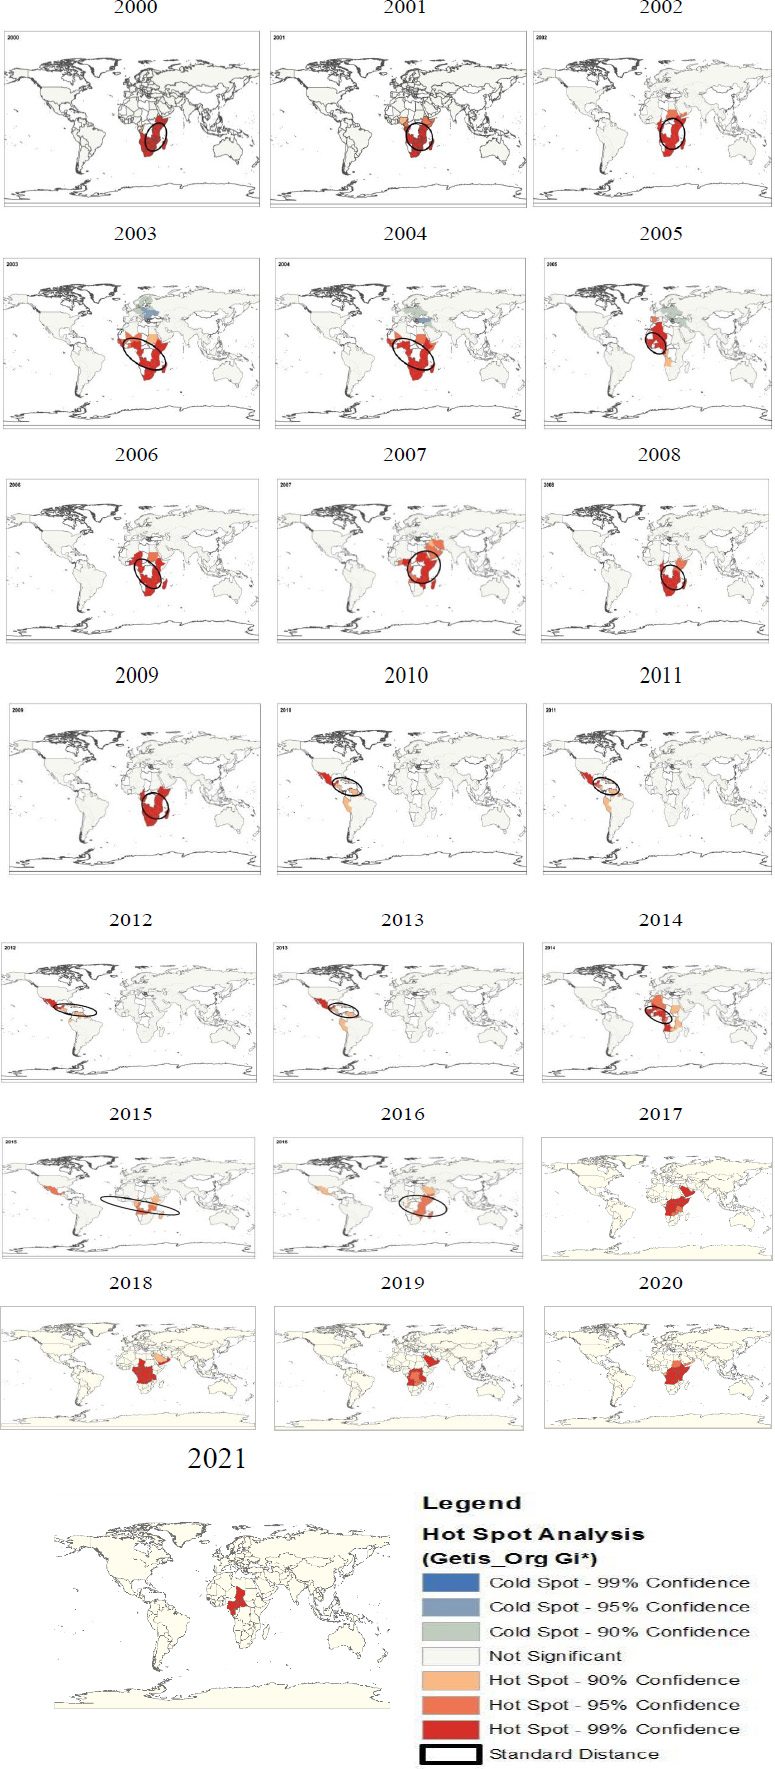
Spatial trend of hot and cold spots of cholera mortality in worldwide during 2000-2021 (according to WHO data).
Percentage of 'death: outbreak' in different continents in 2000-2021.
Total cholera deaths were: Africa: 65513 (Max in Congo, 13304), America: 10145 (Max in Haiti, 9614), Asia: 5431 (Max in Yemen, 4256), Europe: 1 (Germany) and Oceania: 148 (Max in Papua New Guinea, 142).
The highest number of deaths is in the African continent (Congo), followed by Nigeria and the third place is in the American continent (Haiti). Although Yemen ranks first in outbreak, it ranks sixth in deaths (4256 cases). Fig. (5) shows the percentage of deaths to outbreaks in different continents.
4. DISCUSSION
The African continent is known as the main source of cholera and has a high mortality rate. The results of the current study on the outbreak and mortality in Africa were similar to Zerbo et al’s. (2020) study [12]. However, the mortality rate varies from country to country, which may be due to differences in climatic, geographical, and ecological conditions, health infrastructure, civil war, poverty, unsafe food consumption, lack of public knowledge, and so on [13-15]. In Asia, the disease has been reported more in Afghanistan and Yemen than elsewhere, which may be due to insufficient health systems and especially the civil war. The results of a similar study by Al-Mekhlafi (2018) [16] showed Yemen is facing a cholera epidemic and in 2016, there were 1061548 infected persons and 2373 deaths. Outbreaks were first reported in Sana’a city and then spread to Socotra Island. Yemen has a weak health care system due to the war it is facing, with 75% of the population in need of humanitarian assistance and 7.3 million severely food insecure. The care healthcare system is on the verge of collapse as more than 55% of health facilities are partially operational or destroyed. Without proper sanitation water and waste management systems, water resources are polluted and the problem of water scarcity during droughts is a risk factor [17]. India also has a high death rate among Asian countries. This is also mentioned in the study of Lopez et al. (2020) [18], which confirms the results of our study. Outbreaks appear to be exacerbated during the Indian subcontinent due to large beaches with weak sanitation, unsafe drinking water, and high population. Recently, it has been shown that climate conditions also play an important role in the persistence and spread of cholera. When environmental conditions such as temperature, water salinity, and access to nutrients are appropriate, Vibrio cholerae multiplies and can survive for years in an environment without human intervention [19]. Seasonality is another climate characteristic of cholera. Epidemics occur during warm seasons, and countries with more than one warm season per year may have more than one epidemic [20]. The El Niño Southern Oscillation (ENSO) causes the cold waters of the Pacific Ocean to warm and cause phytoplankton to grow, resulting in the proliferation of zooplankton and Vibrio cholera [21]. Overall, cholera is recognized as a major public health problem in developing countries. To cholera control and reduce its mortality, measures such as improved public health, water sanitation, and vaccination are important [22]. Vaccination plays a very important role in cholera control. The WHO recommends the use of oral cholera vaccines (OCVs) in endemic areas and in areas suffering from humanitarian crises where cholera is highly prevalent. With vaccination, people are protected against cholera for approximately three years [23]. The results of the study showed that some European countries are cold spots. From 2003 to 2005, cold spots were formed in Europe. Oprea et al. (2020) [24] examined epidemics in Europe based on microbial genomics, this disease was observed in eastern Europe and continued until 2011. The disease had entered Europe from South Asia. According to the study, the disease has been observed in southern Europe, mostly in different countries during the 1970s, and has entered from northern and western Africa, except 1994, when cholera entered AlbaniaAlbania and Italy from the Black Sea region. In general, the incidence rate in European countries is very low and only one case of death has been reported during this period. This seems to be affected by social and economic conditions and the level of development of European countries [24].
Human health is influenced by various factors. One of the most important and influential factors in this regard is geographical and environmental factors. One of the new technologies that can be used well in providing and promoting health, policy-making, and health decision-making is the Geographic Information System (GIS) [25]. According to our findings, in 2010-2013, hotspots of cholera deaths shifted from Africa to the Americas (Haiti). The results of the mortality centers to Latin America are consistent with the study by Piarroux et al. (2011) [26]. Chinkaka et al. (2024) [27] studied the access to safe drinking water, population density, poverty levels, and climatic factors, including temperature and rainfall, strongly influenced the prevalence of cholera in Malawi on the African continent, which is in line with the current study. According to Madullu et al. (2023) [28], GIS, topography, untreated water, physical and built environments, and health-seeking behaviors played a role in the cholera epidemic in Mwanza city. Spatial analysis suggests patterns of health-seeking behavior rather than disease patterns, which confirms the results of the present study. Spatial analysis of the cholera epidemic in Zimbabwe documented an association between topography (higher elevation above sea level) and lower risk of cholera [29]. By using spatial analysis in GIS, there was significant spatial and temporal variation in cholera patterns among different counties in Kenya [30]. The observed differences in spatial and temporal patterns of cholera can be attributed to geographical variations and socio-economic factors in the study areas. The relocation of death centers from Africa to the Americans, especially Haiti, was due to poor sanitation, as people used sewage-contaminated river water, which contained high levels of cholera bacteria, to cook and drink. Some also used contaminated water for rice cultivation and were thus exposed to contamination. A common feature of countries with hot spots is that they are developing. The WHO also emphasizes the early diagnosis and treatment of cholera among these countries. The countries that were introduced as hot spots of cholera-related deaths were developing and low-middle-income countries. These results are consistent with the study by Idoga et al. (2019) [31]. Mwaba i.e. (2023) surveyed cholera hotspots in Zimbabwe using GIS. The results of the spatial analysis identified 16 areas that were significantly at risk of cholera (ranging from 1.25 to 78.87 times higher than the other). Proximity to water was the only factor associated with an increased risk of cholera [32]. Understanding the combined effects of socioeconomic status is complex and requires further research; however, the present study can provide a suitable model for preventive decisions and the possibility of resource allocation. It is suggested that the registration and collection of cholera mortality data be paid for nationally and internationally, especially after 2016, and health policymakers are advised to pay special attention to health planning. Strategic measures such as water, sanitation, and hygiene interventions, community awareness on proper water storage, cholera disease management, vaccination campaigns, and space-based surveillance systems are recommended in affected areas [27].
CONCLUSION
The present study showed cholera outbreaks spread from Africa to the Americas and Asia during the period 2000-2021. But, the number of hot spots did not change. These centers were concentrated in Africa in 2000, andhas been extended to American and Asian countries over the 22 years. In fact, this study allows health planners and policymakers to use visual assessment, information, and rapid identification of the prevalence of cholera outbreaks and mortality. Using GIS, spatial data can be collected, analyzed, and displayed, which helps governments and health organizations make better decisions about disease management. For example, using GIS in a cholera control program can identify the location and area of cholera-infected areas, manage water resources and sewage systems, predict climate conditions in the study areas, and use spatial data analysis to improve health decision-making. On the other hand, prevention is always cost-effective than cure. Cholera can be prevented by taking simple steps such as properly disinfecting raw fruits and vegetables, especially during the warm season, avoiding eating seafood grown in water containing sewage, and not using stagnant water. One of the limitations in the current study is the lack of study of other geographical factors affecting the pathology of cholera due to the inability to fully access their data. It is suggested that future research surveys the role of socioeconomic factors, as well as climatic factors such as temperature and annual rainfall, in the outbreak of cholera in different regions of the world. Since our study used secondary data, the authors attempted to minimize bias by displaying outliers, independent analysis of results by an independent biostatistician, and reporting all incidence and mortality in all 117 countries that reported data. The title, abstract, and conclusion provide a balanced and representative summary of the results.
AUTHORS’ CONTRIBUTION
It is hereby acknowledged that all authors have accepted responsibility for the manuscript's content and consented to its submission. They have meticulously reviewed all results and unanimously approved the final version of the manuscript.
LIST OF ABBREVIATIONS
| GIS | = Geographical Information System |
| OCVs | = Oral Cholera Vaccines |
| WHO | = World Health Organization |
ETHICAL STATEMENT
This study was approved by Kermanshah University of Medical Sciences, Iran (IR.KUMS.REC.1398.646).
AVAILABILITY OF DATA AND MATERIALS
The data and supportive information are available within the article.
FUNDING
This work was financially supported by the Kermanshah University of Medical Sciences, Iran (Grant number: 980489).
ACKNOWLEDGEMENTS
The authors acknowledge the financial support provided by the Kermanshah University of Medical Sciences, Iran (IR.KUMS.REC.1398.646).