All published articles of this journal are available on ScienceDirect.

Derived Dietary Patterns and Mental Health in Apparently Healthy Iranian Adults: A Cross-Sectional Study
Authors Info & Affiliations
Abstract
Background
Mental health diseases rank among the most prevalent global health concerns for a large proportion of the population. This study explored the connection between meal-based dietary patterns and mental health among adults living in Iran.
Methods
We conducted a cross-sectional study on healthy adults in Iran, and the outcome was measured using the shortened version of the Depression, Anxiety, and Stress Scale (DASS-21). To identify the major dietary patterns, we employed Principal Component Analysis (PCA) and Latent Class Analysis (LCA). We investigated the relationship between these dietary patterns and mental health using a multivariate logistic regression.
Results
Anxiety, depression, and stress were identified in 54.6%, 53.9%, and 56.6% of cases in the 434 participants, respectively. Three major dietary patterns were identified based on PCA— namely “Flexitarian,” “Protein,” and “Western,” and LCA: “Picky,” “Prudent,” and “Modern Iranian” patterns. We found that the LCA-Prudent group had significantly higher scores for three dietary patterns (PCA-Flexitarian, PCA-Protein, and PCA-Western) than the other groups when we compared the PCA-derived scores across the LCA classes. In contrast, the LCA-Picky group had the lowest scores for the PCA-Protein pattern compared to the other groups. Higher adherence to the “Flexitarian” pattern was associated with 44% lower stress levels (OR: 0.56; 95% CI: 0.32-0.96; p = 0.04), while adherence to the “Western” pattern was observed to be associated with 109% higher likelihood of being stressed (OR: 2.09; 95% CI: 1.21-3.61; p = 0.02). Meanwhile, the “Protein” pattern was associated with a lower risk of anxiety (OR: 0.48; 95% CI: 0.30-0.80). In comparison to the “Picky” pattern, the “Modern Iranian” pattern, unlike the “Prudent” pattern, was associated with a 42% lower risk of anxiety (OR: 0.58; 95% CI: 0.34-0.98) in this study population.
Conclusion
The study employed two methods, PCA and LCA, to identify dietary patterns and highlight the potential for varying results depending on the method used. These findings suggested that dietary patterns may play a role in promoting mental health and could be useful in developing interventions for individuals with anxiety, depression, and stress. Further research is necessary to validate these associations and better understand the underlying mechanisms.
1. INTRODUCTION
According to the Mental Health Foundation's definition from 2008, a person's mental health is determined by their feelings, self-perception, and outlook on life, all of which have an impact on how they deal with challenges [1]. Previous studies report an estimated one billion people worldwide to have mental illness [2]. As in many countries, Iran has witnessed a rise in the prevalence of mental health illnesses. In 1999 [3] and 2015 [4], it was estimated that roughly 20.0% and 23.4% of adults aged 15 and older suffered from mental health issues. In addition, a recent population-based survey conducted on 24,584 people over the age of 15 in Iran between December 2019 and February 2020 found that the prevalence of mental disorders was 29.7% [5], showing an upward trend over time. Evidence of the connection between physical and mental health is mounting, people are increasingly beginning to understand the correlation between mental and physical health [6]. Many factors have been associated with an increased risk of mental disorders, such as an individual's body composition [7-10], physical activity [11-13], and diet/dietary patterns [14-16].
The way foods are combined and consumed together has a more significant impact on health than the individual nutrients or food groups eaten alone [17]. Dietary patterns have been reported as an effective approach in investigating diet-disease association [18, 19]. While there is much evidence to suggest links between patterns of dietary intake and anxiety, depression, or stress, in contrast, there are some conflicting findings in the studies showing that eating unhealthy foods can worsen mood disorders such as anxiety and depression, along with other mental health issues [20, 21]. In a study involving 13,486 kids and teenagers, researchers found a link between junk food and mental distress [22, 23]. Furthermore, a 'Western' dietary pattern was reported to be associated with an increased risk of mental health issues such as depression in adolescents [23, 24]. On the other hand, research indicates that a healthier diet—rich in fruits, vegetables, and whole grains—correlates with a reduced risk of depression, anxiety, and stress [25-28]. Conversely, certain studies indicate a vegetarian diet might elevate the risk and symptoms of depression [29-31]. The dietary intake, genetics, and other characteristics in developed countries are different compared to those in Iran and the majority of these studies are from Western or developed countries. This study sets out to explore the relationship between dietary patterns identified through empirical research and mental health conditions, including anxiety, depression, and stress, among adults in Iran.
2. METHODS
2.1. Study Design and Selection of Participants
The method used in the current investigation has been discussed in our previous study [32]. This cross-sectional study was conducted on apparently healthy subjects (Subjects who show no evident signs of illness or disease and therefore present no manifestations suggesting compromised health) between the ages of 20 and 59. Both male and female participants were included in this study. Additionally, the subjects were all residents of Tehran. The study excluded pregnant and breastfeeding women and participants with diabetes, cancer, cardiovascular illness, rheumatoid arthritis, and chronic liver disease. Moreover, subjects with a history of stroke, heart attack, Alzheimer's disease, or Parkinson's disease, as well as those on special diets, were excluded from the study.
2.2. Sample Size Determination
An online sample size calculator (http://www.raosoft. com/samplesize.html) was used to determine the sample size using the following parameters— 40% for the prevalence of mental health disorders, 95% for accurate results, and 5% for error margin. An earlier investigation on the prevalence of mental health disorders in Iranian adults reported a prevalence rate of 40%, which was used as the basis for the sample size calculation in the present study [33]. The statistical power of 95% was chosen to ensure a robust detection of differences, given the diverse dietary habits and mental health outcomes in a target population. This approach ensures that even subtle yet significant variations can be identified, contributing to a more nuanced understanding of the relationship between diet and mental health. We required 363 people for this investigation based on this methodology.
2.3. Mental Health
To assess mental health, we employed the Depression, Anxiety, and Stress Scale (DASS-21) in its shortened form. This self-report questionnaire, consisting of 21 items, evaluates the primary symptoms associated with depression, anxiety, and stress, with seven questions for each domain. Participants evaluated each item using a four-point scale, reflecting their experiences from the past week. A Likert scoring system of 0-1-2-3 was employed, allowing ratings to range from 0 to 63, where lower scores signify a better state of mental health [34]. The questionnaire's validity and reliability have been verified in a prior study conducted in Iran [35].
2.4. Dietary Assessment
Dietary intake data were collected using a semi-quantitative Food Frequency Questionnaire specifically designed and validated for the Iranian population. This questionnaire includes 147 food items, designed to assess participants' dietary intake. It was administered through face-to-face interviews [36]. The trained interviewer administered the questionnaire to all subjects to minimize random errors. A predictable average daily intake of food parameters (including macro and micronutrients) was then calculated using Nutritionist IV software (version 7.0; N-Squared Computing, Salem, OR), adjusted for Iranian foods, after we converted the portion sizes of the consumed foods into grams [37], using household methods. The sum of the calorie intake from each food item was used to determine each subject's overall calorie intake. It was deemed unrealistic for women to consume less than 2100 kJ (500 kcal) or more than 14,700 kJ (3500 kcal) per day and for men to consume less than 3360 kJ (800 kcal) or more than 16,800 kJ (4000 kcal) per day [38, 39]. The foods consumed were organized into 20 distinct groups based on their nutrient profiles and culinary applications (see Annexure Table 1). Subsequently, dietary patterns were extracted.
2.5. Covariates
We gathered sociodemographic information on age, gender, education, marital status, smoking habits, medical history, usage of medications or supplements, and menopause status in order to assess the variables that might have an impact on the result. In addition, we measured the subjects' physical activity levels using the International Physical Activity Questionnaire (IPAQ). Based on their degree of physical activity, we divided the participants into three groups: those who did not exercise at all, those who exercised moderately (1-3 hours weekly), and the highly active group (over 3 hours weekly).
2.6. Statistical Analysis
Firstly, the Kaiser–Meyer–Olkin (KMO), which gauges sampling adequacy, and Bartlett’s test of sphericity, which assesses the existence of relationships within the data, were used to determine the suitability of the dataset for determining dietary patterns. With the components rotated by orthogonal transformation, we employed Principal Component Analysis (PCA) to determine the key dietary patterns based on the 20 food classes [40]. Varimax rotation was applied to enhance the clear interpretation of the factors analyzed. The factors that were kept were determined by the Scree plot and eigenvalues greater than 1 [41, 42]. The food groups with commonalities < 0.2 were excluded. While higher cutoffs (0.3 or 0.4) are commonly used, the 0.2 threshold was selected to ensure the inclusion of relevant food groups that contribute meaningfully to dietary patterns. Ultimately, the regression approach was used to determine standardized dietary pattern scores for each participant for each dietary pattern. Food groups with higher loadings and the diets they represented served as the basis for the designations of dietary patterns. We classified the individuals according to the tertiles of the dietary pattern score after determining the main dietary patterns that accounted for the majority of the variance.
We identified distinct subgroups of participants with comparable eating habits using Latent Class Analysis (LCA) [43, 44]. We separated each food item into consumption categories based on the percentage of zeros [45] to help lessen the effects of noncontinuous variables and zero inflations. Food items that contained up to 20% zeros were grouped into tertiles; those that contained over 20% but less than 80% zeros were further separated into three groups: no consumption, those that were consumed below the median, and those consumed above the median. Using the Lo-Mendell-Rubin likelihood ratio test, the Bayesian Information Criterion (BIC), the Akaike Information Criterion (AIC), the Adjusted Bayesian Information Criterion (ABIC), and entropy, we first performed Latent Class Analysis (LCA) with 1–7 categories in order to determine the optimal number of classes. The optimal number of classes was chosen based on the AIC, BIC, ABIC, and entropy values. Subsequently, we applied the identified optimal number of classes for LCA and assigned individuals to their respective classes based on the highest likelihood of class membership. Lastly, we characterized the dietary patterns by calculating the weighted prevalence of individuals in the extreme categories of food item consumption for each pattern.
To find significant differences between tertile categories of dietary pattern scores, we employed chi-square tests for qualitative variables and one-way ANOVA with Bonferroni correction for quantitative data. We contrasted the average factor scores of the PCA-identified habitual dietary habits across the LCA-identified classes. In this study, we deployed multiple logistic regression analyses in different models to determine the association of adherence to dietary patterns, mealtime distribution of macronutrients, and obesity with mental health status. To determine the joint association between our dependent variable and independent variables, the Two-Way ANOVA was used. All statistical analyses were performed using Statistical Package for Social Science (SPSS version 16; SPSS Inc., Chicago, IL, USA) and Jamovi (Version 2.3.26, The Jamovi Project, Sydney, Australia). P < 0.05 was considered as significant.
3. RESULTS
3.1. General Characteristics of the Study Participants
Annexure Table 2 shows the overall characteristics of the study participants, grouped by their mental health state. A total of 434 patients participated in our study. Among them, 237 (54.6%) were experiencing anxiety, 234 (53.9%) had depression, and 246 (56.6%) reported symptoms of stress. Women comprised 52% of the study population. The average age of the participants was 38.57 years, with a standard deviation of 9.67 years. We observed significant variations between respondents who were anxious and those without, across different genders (P = 0.02), educational levels (P = 0.007), and employment positions (P = 0.001). Individuals experiencing stress displayed noticeable differences in age and gender (P = 0.006), marital status (P = 0.04), educational levels (P = 0.02), employment status (P = 0.004), and smoking habits (P = 0.03). The average values of the physical measurements did not show any statistically significant differences among the groups.
| Dietary Patterns | |||
|---|---|---|---|
| Food Groups | Flexitarian | Protein | Western |
| Legumes | 0.771 | - | - |
| Soy | 0.653 | - | - |
| Whole grains | 0.632 | - | - |
| Poultry | - | 0.783 | - |
| Meat | - | 0.676 | 0.203 |
| Egg | 0.215 | 0.464 | |
| Fast foods and snacks | - | - | 0.640 |
| Solid oils | - | - | 0.632 |
| Condiments | - | - | 0.468 |
| Vegetables | 0.235 | - | - |
| Dairy | - | 0.212 | - |
| Fish | - | - | - |
| Pickles | 0.268 | - | - |
| Processed meats | - | 0.263 | 0.443 |
| Nuts and seeds | - | - | - |
| Fruits | - | - | - |
| Caffeine | - | - | - |
| Sweets | - | - | 0.274 |
| Refined grains | - | - | - |
| Healthy oils | -0.253 | - | - |
Kaiser–Meyer–Olkin measure of sampling adequacy=0·607. Bartlett’s test of sphericity <0·0001.
Total variance (23.58).
| Class | Log (L) | AIC | BIC | ABIC | Entropy | Class Probability |
|---|---|---|---|---|---|---|
| 1 class | -9329 | 18739 | 18902 | 18775 | 1 | |
| 2 classes | -9057 | 18276 | 18608 | 18351 | 0.747 | 0.63/0.37 |
| 3 classes | -8979 | 18201 | 18700 | 18313 | 0.708 | 0.30/0.37/0.33 |
| 4 classes | -8922 | 18170 | 18836 | 18319 | 0.791 | 0.12/0.40/0.37/0.11 |
| 5 classes | -8836 | 18081 | 18915 | 18268 | 0.826 | 0.07/0.38/0.15/0.23/0.17 |
| 6 classes | -8783 | 18056 | 19058 | 18281 | 0.833 | 0.38/0.16/0.11/0.16/0.09/0.10 |
| 7 classes | -8721 | 18014 | 19185 | 18277 | 0.837 | 0.20/0.06/0.13/0.18/0.15/0.10/0.18 |
3.2. Extracted Dietary Patterns
Table 1 displays the factor loading for major dietary patterns based on the PCA. Three major dietary patterns were identified such as, Flexitarian, Protein, and Western. The patterns accounted for 23.58% of the overall variation in dietary intakes within this population. High loadings for legumes, soy, whole grains, and vegetables distinguished the Flexitarian pattern. The Protein pattern had high loadings for poultry, meat, and egg. The Western pattern was characterized by high loadings for fast foods and snacks, solid oils, condiments, processed meats, and sweets. Other food groups such as fish, nuts and seeds, fruits, caffeine, refined grains, and healthy oils had low factor loadings (< 0.20) and were not strongly associated with any of the identified dietary patterns. The Kaiser-Meyer-Olkin (KMO) measure of sampling adequacy was 0.607, indicating a moderate level of sampling adequacy. Bartlett's test of sphericity was significant (p<0.0001), indicating that the correlation matrix was suitable for PCA.
The fit statistics for a series of latent class analysis models of food group intakes are presented in Table 2. The models were evaluated using various fit statistics, including AIC, BIC, ABIC, entropy, and class probability. The optimal number of classes was determined by simultaneously evaluating the AIC, BIC, and ABIC, preferring lower values. The 3-class model demonstrated substantial improvements over the simpler 2-class model while still maintaining parsimony compared to more complex models (AIC = 18201; BIC = 18700; and ABIC = 18313). Additionally, the model's entropy value was 0.708, which is above the acceptable threshold of 0.60, indicating clear class separation. The class probabilities for this model were 0.30/0.37/0.33. This balanced approach prioritized both statistical and interpretable fit, aligning well with the dietary patterns identified through Principal Component Analysis (PCA).
The conditional probability of the study participants consuming each food group in each class is displayed in Table 3. In a particular latent class, the chance of consuming a food group in high (third tertile or higher median) consumption was around 1, indicating more consumption of that particular food. Subjects in the first tertile who had a low probability of class membership or did not consume any food were shown to have low food intake frequency. We named the three identified classes “Picky,” “Prudent,” and “Modern Iranian” diet, with proportions of participants at 29.8%, 37.2%, and 33.0%, respectively.
The “Prudent” pattern was characterized by a high probability of consuming fruits, vegetables, whole grains, nuts and seeds, solid oils, sweets, caffeine, legumes, processed meat, fish, condiments, dairy, pickles, and soy products. The “Modern Iranian” pattern was featured by the preference for refined grains, healthy oils, fast foods and snacks, and soy foods over solid oils and sweets. In contrast to other classes, the “Picky” class exhibited significantly higher extreme probabilities of not consuming fruits, vegetables, eggs, refined grains, nuts and seeds, meat, poultry, sweets, legumes, fast foods and snacks, processed meat, fish, condiments, dairy, pickles, and soy foods.
| Classes (Dietary Patterns) | Picky | Prudent | Modern Iranian | |
|---|---|---|---|---|
| Proportion of Participants | 29.8% | 37.2% | 33.0% | |
| Food groups | ||||
| Fruits | Tertile 1 | 0.66 | 0.06 | 0.33 |
| Tertile 2 | 0.14 | 0.38 | 0.47 | |
| Tertile 3 | 0.19 | 0.56 | 0.20 | |
| Vegetables | Tertile 1 | 0.65 | 0.15 | 0.26 |
| Tertile 2 | 0.22 | 0.20 | 0.58 | |
| Tertile 3 | 0.13 | 0.65 | 0.16 | |
| Egg | Tertile 1 | 0.52 | 0.24 | 0.27 |
| Tertile 2 | 0.29 | 0.37 | 0.48 | |
| Tertile 3 | 0.19 | 0.39 | 0.25 | |
| Whole grains | Tertile 1 | 0.43 | 0.24 | 0.35 |
| Tertile 2 | 0.19 | 0.34 | 0.46 | |
| Tertile 3 | 0.38 | 0.42 | 0.19 | |
| Refined grains | Tertile 1 | 0.48 | 0.33 | 0.20 |
| Tertile 2 | 0.30 | 0.36 | 0.34 | |
| Tertile 3 | 0.22 | 0.31 | 0.46 | |
| Nuts and seeds | Tertile 1 | 0.60 | 0.09 | 0.35 |
| Tertile 2 | 0.22 | 0.32 | 0.47 | |
| Tertile 3 | 0.18 | 0.59 | 0.18 | |
| Meat | Tertile 1 | 0.67 | 0.11 | 0.28 |
| Tertile 2 | 0.20 | 0.42 | 0.36 | |
| Tertile 3 | 0.13 | 0.47 | 0.36 | |
| Poultry | Tertile 1 | 0.48 | 0.18 | 0.23 |
| Tertile 2 | 0.35 | 0.42 | 0.49 | |
| Tertile 3 | 0.17 | 0.40 | 0.28 | |
| Solid oils | Tertile 1 | 0.37 | 0.14 | 0.52 |
| Tertile 2 | 0.33 | 0.38 | 0.28 | |
| Tertile 3 | 0.29 | 0.48 | 0.20 | |
| Sweets | Tertile 1 | 0.45 | 0.12 | 0.47 |
| Tertile 2 | 0.28 | 0.36 | 0.35 | |
| Tertile 3 | 0.26 | 0.52 | 0.18 | |
| Caffeine | Tertile 1 | 0.34 | 0.27 | 0.40 |
| Tertile 2 | 0.35 | 0.33 | 0.36 | |
| Tertile 3 | 0.31 | 0.40 | 0.24 | |
| Legumes | Tertile 1 | 0.54 | 0.22 | 0.28 |
| Tertile 2 | 0.29 | 0.30 | 0.41 | |
| Tertile 3 | 0.17 | 0.48 | 0.31 | |
| Healthy oils | Tertile 1 | 0.40 | 0.36 | 0.25 |
| Tertile 2 | 0.39 | 0.35 | 0.27 | |
| Tertile 3 | 0.21 | 0.29 | 0.48 | |
| Fast foods and snacks | Tertile 1 | 0.69 | 0.17 | 0.20 |
| Tertile 2 | 0.25 | 0.39 | 0.34 | |
| Tertile 3 | 0.06 | 0.44 | 0.46 | |
| Processed meat | Tertile 1 | 0.53 | 0.29 | 0.22 |
| Tertile 2 | 0.29 | 0.29 | 0.42 | |
| Tertile 3 | 0.18 | 0.42 | 0.36 | |
| Fish | Tertile 1 | 0.55 | 0.24 | 0.25 |
| Tertile 2 | 0.25 | 0.34 | 0.44 | |
| Tertile 3 | 0.20 | 0.42 | 0.31 | |
| Condiments | Tertile 1 | 0.57 | 0.19 | 0.29 |
| Tertile 2 | 0.28 | 0.36 | 0.34 | |
| Tertile 3 | 0.15 | 0.45 | 0.37 | |
| Dairy | Tertile 1 | 0.66 | 0.16 | 0.23 |
| Tertile 2 | 0.23 | 0.31 | 0.44 | |
| Tertile 3 | 0.11 | 0.52 | 0.33 | |
| Pickles | Tertile 1 | 0.66 | 0.15 | 0.25 |
| Tertile 2 | 0.14 | 0.31 | 0.54 | |
| Tertile 3 | 0.20 | 0.54 | 0.21 | |
| Soy | No intake | 0.54 | 0.34 | 0.43 |
| Below median | 0.07 | 0.12 | 0.03 | |
| Upper median | 0.39 | 0.54 | 0.55 | |
3.3. Comparison of Food Items Identified by PCA and LCA
The food items included in dietary patterns identified by the PCA and LCA were different. Therefore, we named each identified dietary pattern differently based on the factor loadings or probabilities. We examined the mean factor scores of the typical eating habits determined by PCA among the groups identified by LCA Fig. (1). The LCA-Prudent class had significantly higher means of PCA-Flexitarian, PCA-Protein, and PCA-Western dietary patterns compared to the other classes. The LCA-Picky class had the lowest means of PCA-Protein pattern compared to the other classes.
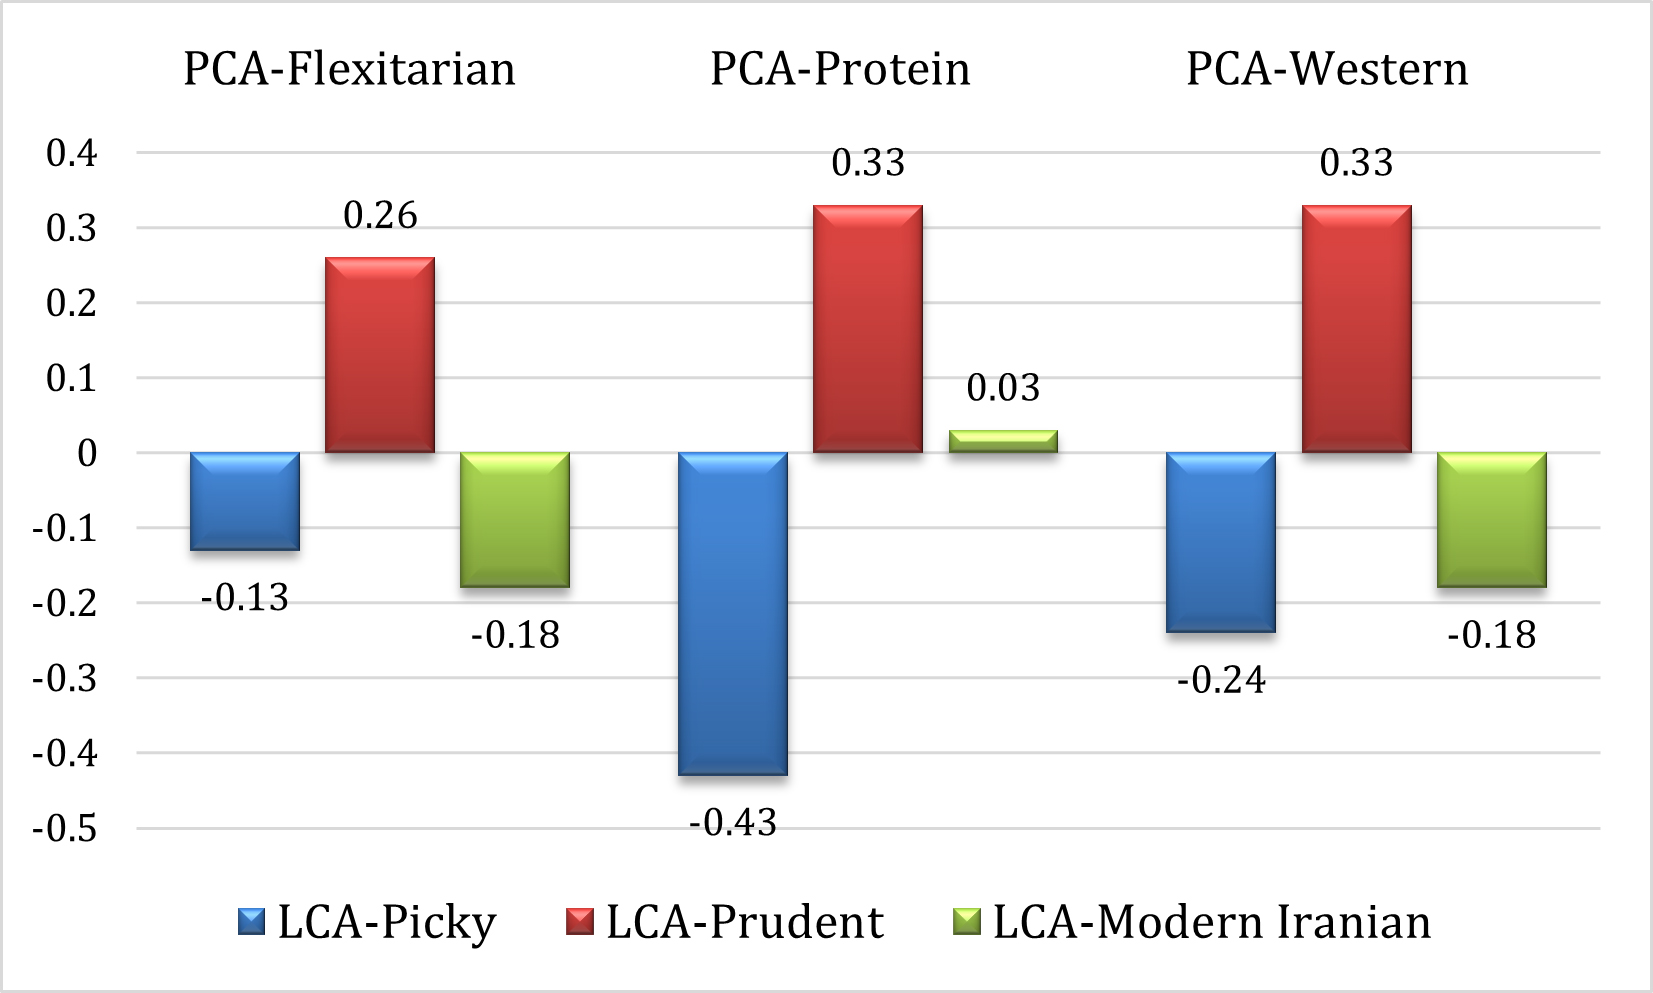
Mean factor scores of the typical eating habits determined by PCA among the groups identified by LCA.
3.4. Mental Health Scores Across Dietary Patterns
Table 4 shows the mental health scores of participants according to the extracted dietary patterns. For the PCA extracted patterns (Flexitarian, Protein, and Western patterns), for the Protein pattern, a significant decreasing trend was observed for anxiety (p=0.003) and stress (p=0.02) scores across tertiles but not for depression (p=0.08). Meanwhile, no significant differences in the mental health scores or trends were observed across the tertiles of the Western and Flexitarian patterns.
For the LCA-derived patterns (“Picky,” “Prudent,” and “Modern Iranian”), there were no significant differences in depression, anxiety, or stress scores across the three classes.
3.5. Association between Mental Health and Dietary Patterns
We observed a significant inverse correlation between the Flexitarian pattern and stress (r=-0.108, p<0.05), while non-significant correlations were found between this pattern and depression or anxiety scores. The Protein pattern had a significant negative correlation with depression (r=-0.112, p<0.05) and anxiety (r=-0.109, p<0.05) scores. Meanwhile, the Western pattern had a significant positive correlation with depression (r=0.138, p<0.001), anxiety (r=0.159, p<0.001), and stress (r=0.185, p<0.001) scores Table 5.
Table 6 shows the Odds Ratios (OR) and 95% Confidence Intervals (CI) for mental health disorders according to tertiles of dietary identified by the PCA. The study found that following a Flexitarian diet did not have any significant links with anxiety or depression. However, individuals in the highest tertile of the dietary pattern had a lower risk of stress (OR: 0.57; 95% CI: 0.35-0.92) in the crude model. This association remained significant even after adjusting for all potential confounders (OR: 0.56; 95% CI: 0.32-0.96). Contrary to the Flexitarian pattern, higher adherence to the Western dietary pattern was associated with higher odds of stress in the crude model (OR: 2.02; 95% CI: 1.25-3.27), the effect remained significant after adjusting for all potential confounders (OR: 2.09; 95% CI: 1.21-3.61). However, subjects following the Protein dietary pattern had lower odds of anxiety in the second tertile with a significant trend (OR: 0.50; 95% CI: 0.31-0.80, p=0.004). This association remained significant throughout the adjusted models.
Table 7 presents the Odds Ratios (ORs) and 95% Confidence Intervals (CIs) for the association of LCA-derived dietary patterns and mental disorders risk. We observed no significant association between any of the dietary patterns with depression or stress. In the crude analysis, anxiety was not significantly associated with any of the dietary patterns. However, compared with the Picky pattern, after adjusting for age, gender, and energy intake (Model 1), we observed a significant inverse association between the Modern Iranian pattern and anxiety (OR: 0.56; 95% CI:0.33-0.93). This finding remained consistent after further adjusting for other potential confounders such as marital status, education, smoking status, physical activity, diabetes mellitus (Model 2) (OR: 0.58; 95% CI: 0.34-0.98), and BMI (Model 3) (OR: 0.58; 95% CI: 0.34-0.98). The trends in the associations were, however, not significant.
| T1 (142) | T2 (143) | T3 (142) | P-trend | |
|---|---|---|---|---|
| Mean ± SD | Mean ± SD | Mean ± SD | ||
| PCA Extracted Dietary Patterns | ||||
| Flexitarian Pattern | ||||
| Depression | 9.63 ± 8.16 | 11.48 ± 10.06 | 9.43 ± 9.31 | 0.85 |
| Anxiety | 8.32 ± 8.01 | 8.69 ± 8.01 | 7.79 ± 8.23 | 0.57 |
| Stress | 14.93 ± 9.31 | 15.62 ± 10.31 | 13.08 ± 9.90 | 0.08 |
| Protein Pattern | ||||
| Depression | 11.56 ± 10.37 | 9.69 ± 8.21 | 9.30 ± 9.13 | 0.08 |
| Anxiety | 9.80 ± 8.92 | 6.99 ± 7.02 | 8.03 ± 7.98 | 0.003 |
| Stress | 15.75 ± 10.25 | 13.16 ± 8.98 | 14.47 ± 10.27 | 0.02 |
| Western Pattern | ||||
| Depression | 8.85 ± 9.05 | 10.71 ± 9.39 | 10.99 ± 9.39 | 0.09 |
| Anxiety | 7.17 ± 7.91 | 8.57 ± 8.30 | 9.06 ± 7.94 | 0.14 |
| Stress | 12.67 ± 9.64 | 14.91 ± 10.29 | 16.06 ± 9.47 | 0.05 |
| LCA Extracted Dietary Patterns | ||||
|
Picky (126) |
Prudent (163) |
Modern Iranian (140) |
||
| Depression | 11.17 ± 9.43 | 9.74 ± 9.11 | 9.86 ± 9.52 | 0.19 |
| Anxiety | 8.70 ± 8.70 | 8.45 ± 7.60 | 7.62 ± 8.01 | 0.79 |
| Stress | 14.98 ± 10.29 | 14.58 ± 9.50 | 14.16 ± 9.99 | 0.73 |
| Depression | Anxiety | Stress | Flexitarian Pattern | Protein Pattern | Western Pattern | |
|---|---|---|---|---|---|---|
| Depression | — | |||||
| Anxiety | 0.578 *** | — | ||||
| Stress | 0.680 *** | 0.679 *** | — | |||
| Flexitarian Pattern | -0.045 | -0.067 | -0.108 * | — | ||
| Protein Pattern | -0.112 * | -0.109 * | -0.051 | 0.018 | — | |
| Western Pattern | 0.138 *** | 0.159 *** | 0.185 *** | 0.078 | 0.026 | — |
| Tertiles of dietary scores odds (95% CI) | ||||
|---|---|---|---|---|
| T 1 (142) | T 2 (143) | T 3 (142) | P-trend | |
| Flexitarian Pattern | ||||
| Depression | ||||
| Crude | 1.00 | 1.17 (0.73-1.86) | 0.80 (.050-1.27) | 0.51 |
| Model 1a | 1.00 | 1.23 (0.76-1.99) | 0.84 (0.50-1.40) | 0.39 |
| Model 2b | 1.00 | 1.16 (0.71-1.90) | 0.78 (0.46-1.32) | 0.55 |
| Model 3c | 1.00 | 1.17 (0.71-1.91) | 0.79 (0.46-1.34) | 0.54 |
| Anxiety | ||||
| Crude | 1.00 | 1.08 (0.67-1.72) | 1.06 (0.66-1.69) | 0.76 |
| Model 1a | 1.00 | 1.12 (0.69-1.82) | 1.05 (0.63-1.76) | 0.63 |
| Model 2b | 1.00 | 1.00 (0.60-1.65) | 0.94 (0.55-1.60) | 0.99 |
| Model 3c | 1.00 | 1.00 (0.60-1.65) | 0.94 (0.55-1.61) | 0.99 |
| Stress | ||||
| Crude | 1.00 | 1.04 (0.66-1.66) | 0.57* (0.35-0.92) | 0.85 |
| Model 1a | 1.00 | 1.13 (0.70-1.83) | 0.61 (0.36-1.04) | 0.63 |
| Model 2b | 1.00 | 1.05 (0.64-1.72) | 0.55* (0.32-0.95) | 0.87 |
| Model 3c | 1.00 | 1.05 (0.64-1.72) | 0.56* (0.32-0.96) | 0.86 |
| Protein Pattern | ||||
| Depression | ||||
| Crude | 1.00 | 0.99 (0.62-157) | 0.87 (0.54-1.39) | 0.95 |
| Model 1a | 1.00 | 1.01 (0.63-1.62) | 0.88 (0.54-1.44) | 0.96 |
| Model 2b | 1.00 | 1.04 (0.65-1.67) | 0.91 (0.56-1.49) | 0.87 |
| Model 3c | 1.00 | 1.03 (0.64-1.66) | 0.91 (0.55-1.49) | 0.89 |
| Anxiety | ||||
| Crude | 1.00 | 0.50* (0.31-0.80) | 0.75 (0.47-1.20) | 0.004 |
| Model 1a | 1.00 | 0.49* (0.30-0.79) | 0.73 (0.45-1.18) | 0.003 |
| Model 2b | 1.00 | 0.49* (0.30-0.80) | 0.78 (0.47-1.28) | 0.004 |
| Model 3c | 1.00 | 0.48* (0.30-0.80) | 0.78 (0.47-1.28) | 0.004 |
| Stress | ||||
| Crude | 1.00 | 0.68 (0.43-1.09) | 0.82 (0.51-1.31) | 0.10 |
| Model 1a | 1.00 | 0.70 (0.44-1.14) | 0.84 (0.51-1.37) | 0.15 |
| Model 2b | 1.00 | 0.72 (0.44-1.17) | 0.85 (0.51-1.40) | 0.18 |
| Model 3c | 1.00 | 0.71 (0.44-1.16) | 0.85 (0.51-1.40) | 0.18 |
| Western Pattern | ||||
| Depression | ||||
| Crude | 1.00 | 1.54 (0.96-2.46) | 1.37 (0.85-2.20) | 0.18 |
| Model 1a | 1.00 | 1.51 (0.94-2.44) | 1.40 (0.84-2.34) | 0.20 |
| Model 2b | 1.00 | 1.49 (0.92-2.42) | 1.33 (0.79-2.25) | 0.24 |
| Model 3c | 1.00 | 1.49 (0.92-2.41) | 1.30 (0.76-2.21) | 0.26 |
| Anxiety | ||||
| Crude | 1.00 | 1.22 (0.76-1.97) | 1.68* (1.04-2.70) | 0.09 |
| Model 1a | 1.00 | 1.18 (0.73-1.91) | 1.56 (0.93-2.61) | 0.22 |
| Model 2b | 1.00 | 1.16 (0.71-1.91) | 1.48 (0.87-2.53) | 0.33 |
| Model 3c | 1.00 | 1.16 (0.71-1.91) | 1.49 (0.87-2.54) | 0.34 |
| Stress | ||||
| Crude | 1.00 | 1.43 (0.88-2.32) | 2.02* (1.25-3.27) | 0.01 |
| Model 1a | 1.00 | 1.38 (0.84-2.27) | 2.20* (1.30-3.75) | 0.01 |
| Model 2b | 1.00 | 1.36 (0.82-2.24) | 2.10* (1.22-3.60) | 0.02 |
| Model 3c | 1.00 | 1.05 (0.64-1.72) | 0.56* (0.32-0.96) | 0.18 |
| Latent classes Odds (95% CI) | ||||
|---|---|---|---|---|
|
Picky (126) |
Prudent (163) |
Modern Iranian (140) |
P-trend | |
| Depression | ||||
| Crude | 1.00 | 0.72 (0.45-1.15) | 0.73 (0.45-1.18) | 0.48 |
| Model 1a | 1.00 | 0.64 (0.37-1.11) | 0.66 (0.40-1.09) | 0.40 |
| Model 2b | 1.00 | 0.63 (0.36-1.10) | 0.66 (0.40-1.10) | 0.41 |
| Model 3c | 1.00 | 0.61 (0.35-1.08) | 0.65 (0.39-1.09) | 0.67 |
| Anxiety | ||||
| Crude | 1.00 | 1.00 (0.63-1.60) | 0.63 (0.39-1.03) | 0.61 |
| Model 1a | 1.00 | 0.81 (0.46-1.40) | 0.56* (0.33-0.93) | 0.55 |
| Model 2b | 1.00 | 0.86 (0.49-1.51) | 0.58* (0.34-0.98) | 0.55 |
| Model 3c | 1.00 | 0.85 (0.48-1.51) | 0.58* (0.34-0.97) | 0.49 |
| Stress | ||||
| Crude | 1.00 | 1.11 (0.69-1.77) | 0.92 (0.56-1.49) | 0.47 |
| Model 1a | 1.00 | 1.20 (0.68-2.10) | 0.86 (0.51-1.44) | 0.70 |
| Model 2b | 1.00 | 1.21 (0.68-2.15) | 0.87 (0.51-1.47) | 0.72 |
| Model 3c | 1.00 | 1.20 (0.68-2.14) | 0.87 (0.51-1.47) | 0.34 |
4. DISCUSSION
In this research, the dietary habits of a group of apparently healthy Iranian adults were analyzed using two distinct methods - PCA and LCA. The findings showed that the different methods resulted in different dietary patterns. PCA identified three distinct patterns - “Flexitarian,” “Protein,” and “Western,” while LCA identified three others - “Picky,” “Prudent,” and “Modern Iranian.” The study also examined how well the classes derived by LCA could be matched to the dietary patterns identified by PCA. The results demonstrated that the LCA-Prudent class had significantly higher average scores of corresponding PCA-dietary patterns compared to the other classes. We observed no significant association between any of the PCA-derived dietary patterns and depression. However, Stress levels were negatively correlated with higher adherence to the “Western” and “Flexitarian” patterns. The “Protein” pattern, on the other hand, was substantially linked to a decreased risk of anxiety. According to the LCA, the “Modern Iranian” pattern—but not the “Prudent” pattern—was linked to a reduced likelihood of anxiety in this study sample when compared to the “Picky” pattern.
Literature on the association between major dietary patterns and mental health disorders such as depression, anxiety, and stress are growing rapidly. While there is a lot of evidence to suggest an association between dietary patterns and anxiety, depression, or stress, there are some conflicting findings in the research.
Many studies have found that eating a healthier diet, one that includes plenty of fruits, vegetables, and whole grains, can help reduce the chances of feeling depressed, anxious, or stressed [25-28]. In the North West Adelaide Health Study [46], findings indicated that a 'prudent' pattern tended to be associated with a reduced risk of depression. In a study by Zakizadeh et al. [47], compared with the lowest tertile, individuals in the highest tertile of a healthy diet had a lower risk of depression and anxiety. Moreover, other studies [27, 48] observed significant inverse associations between adherence to a healthy dietary pattern with anxiety, depression, and stress. Meanwhile, a recent investigation [49] found a non-significant association between Healthy dietary patterns and depression, anxiety, or stress.
Previous research has shown varying results concerning the link between a vegetarian diet and mental health outcomes, particularly in relation to depression, anxiety, and stress. A recent study by Storz and Ranco, aligning with our study [50], found no association between adherence to a vegetarian diet and depression. Additionally, a systematic review and meta-analysis of observational studies found a non-significant association between vegetarian diets and levels of depression or anxiety symptoms [51]. Meanwhile, Hosseinzadeh et al. [52] found a significant inverse association between the lactovegetarian dietary pattern and the odds of psychological distress. Moreover, other studies found that vegetarian diets were related to lower depression, anxiety, or stress scores [31, 53, 54]. It's important to mention that newer findings indicate that following a vegetarian or vegan diet might raise the chances of experiencing depression and its related symptoms [29-31].
In line with our study, a recent observational study [27] found that greater adherence to the “fish and poultry” pattern was related to lower odds of mental disorders. Some research has shown that eating more animal protein can increase the chances of experiencing depression, anxiety, and stress [55]. For instance, a study of Chinese teenagers found that those who ate a lot of meat reported more symptoms of depression and anxiety [56]. In comparison, another study suggested that certain types of animal-based proteins might help reduce anxiety and aid individuals dealing with post-traumatic stress disorder [57].
In the study by Arab et al. [48], no significant association was observed between Traditional dietary patterns and depression, anxiety, or stress. Additionally, another research [49] found a non-significant association between Traditional Iranian patterns and mental disorders. A study by Hosseinzadeh et al. [52] discovered traditional eating habits are linked to lower levels of depression in men. However, the same study showed that these eating habits are associated with a higher risk of depression in women.
The link between the Western dietary pattern and mental disorders remains unclear. While some studies have indicated a positive association between Western dietary patterns and mental disorders [25, 26, 46], other studies have not identified such an association [48, 49, 52]. Contrary to our findings, Arab et al. [48] suggested no significant association between the Western dietary pattern and depression, anxiety, or stress. Similarly, Janmohammadi et al. [49] found a non-significant association between the Western dietary pattern and depression, anxiety, or stress among earthquake victims. Meanwhile, a previous study [25] found a strong positive association between the Western dietary pattern and anxiety and stress. In addition, the results of other studies, including a meta-analysis [26, 46], suggest that the Western-style dietary pattern may increase the risk of depression.
Recent studies have shown a link between mental disorders and diet, but the exact mechanisms are still not fully understood. Consuming a nutritious diet can have a beneficial effect on mental health using various mechanisms such as anti-inflammatory, antioxidant, neurogenesis, microbiome modulation, and immune modulation [58]. One theory suggests the building blocks of the brain, such as monoamine neurotransmitters, are derived from dietary amino acids [59]. Another possibility is through the gut-brain axis [20]. This intriguing connection indicates that the health and balance of gut microbes can significantly influence brain function and mental well-being. Research suggests that dietary protein, particularly tryptophan, may help alleviate anxiety symptoms, while protein malnutrition may make them worse [60]. Inadequate energy metabolism has also been linked to stress-related anxiety [60]. Essential nutrients like omega-3 fatty acids, B vitamins, amino acids, folate, vitamin D, minerals, plant-based antioxidants, and microbiotics are vital for the structure and function of the brain and can greatly affect mental health. As such, a healthy dietary pattern that incorporates these nutrients can potentially prevent or slow down the advancement of specific mental health conditions.
4.1. Limitations
Our investigation has some limitations that need to be acknowledged. Firstly, since our study was cross-sectional, a cause-and-effect relationship can not be established. Misclassification of study participants is another concern due to the FFQ use. Additionally, there is a possibility of measurement error, which is a common issue with any method of dietary assessment. Although our study has some limitations, it also has several advantages. It is the first to investigate the association between mental illness and dietary patterns derived from two different data reduction techniques. Additionally, we assessed mental health using a validated questionnaire. Furthermore, we included both sexes and adjusted for several potential confounding factors that may affect mental health.
CONCLUSION
In conclusion, this study underscores the significant relationship between dietary patterns and mental health outcomes among Iranian adults. The identification of distinct dietary patterns, “Flexitarian,” “Protein,” and “Western,” alongside “Picky,” “Prudent,” and “Modern Iranian”—highlights the complexity of dietary influences on mental well-being. We observed no link between any of the dietary patterns derived from the PCA and depression. However, there was a substantial inverse relationship between stronger adherence to the “Flexitarian” and “Western” patterns and lower stress levels, whereas the “Protein” pattern was associated with a lower risk of anxiety. Furthermore, we found an inverse relationship between the “Modern Iranian” pattern and the risk of anxiety. These findings emphasize the potential of dietary interventions as a vital component in strategies aimed at enhancing mental health. Considering the rising prevalence of mental health disorders globally, further research is essential to validate these associations, investigate the underlying mechanisms, and ultimately inform public health initiatives geared towards improving mental health through dietary modifications. Addressing these connections could contribute significantly to holistic approaches to mental health care and prevention.
AUTHORS' CONTRIBUTIONS
A.T.J., S.S-B., and K.D.J.: The research was conceived and designed; A.T.J., A.T.J.: Statistical analysis and interpretation of data were performed; S.S-B. and K.D.J.: Wrote the manuscript, and the revision of the manuscript for important intellectual content was carried out;. All authors reviewed and approved the final version of the manuscript.
LIST OF ABBREVIATIONS
| DASS | = Depression Anxiety and Stress Scale |
| FFQ | = Food Frequency Questionnaire |
| IPAQ | = International Physical Activity Questionnaire |
| LCA | = Latent Class Analysis |
| PCA | = Principal Component Analysis |
ETHICS APPROVAL AND CONSENT TO PARTICIPATE
The study guidelines were approved by the ethical committee of the Tehran University of Medical Sciences, Iran (Ethics No: IR.TUMS.MEDICINE.REC.1401.325).
HUMAN AND ANIMAL RIGHTS
All procedures performed in studies involving human participants were in accordance with the ethical standards of institutional and/or research committees and with the 1975 Declaration of Helsinki, as revised in 2013.
CONSENT FOR PUBLICATION
After informing participants in detail about the study's aim, they signed written informed consent before the start of the study.
AVAILABILITY OF DATA AND MATERIALS
The data supporting the findings of the article is available upon reasonable request from the corresponding author [A.T.J]. The dataset has not been deposited in a public repository due to restrictions related to participant privacy and institutional policy.
ACKNOWLEDGEMENTS
The authors acknowledge the study participants for their cooperation and assistance.
| Food groups | Food items |
|---|---|
| Fruits | Different kinds of fresh fruits, dry fruits, natural fruit juice, fruit conserves, industrial juice |
| Vegetables | Yellow, green leafy, and all other types of vegetables |
| Egg | Eggs |
| Whole grains | Dark Iranian bread (e.g., barbari, sangak, taftun), cooked potato, barely |
| Refined grains | White bread including lavash, baguette, rice, pasta, vermicelli, cake, and biscuits |
| Nuts and seeds | Walnuts, peanuts, pistachios, hazelnuts, almonds, seeds |
| Meat | Beef, lamb, and all types of organ meats |
| Poultry | Chicken |
| Solid oils | Hydrogenated vegetable oil, animal oil, margarine, butter, mayonnaise |
| Sweets | Confectionary products, sugar, jam, honey, candy |
| Caffeine | Tea, coffee, chocolate, cacao |
| Legumes | Different kinds of beans, peas, and lentils |
| Healthy oils | Vegetable oils, olive |
| Fast foods and snacks | Pizza, potato chips, French fries, cheese snacks |
| Processed meat | Sausage, hamburger, other |
| Fish | All types of fish, canned tuna |
| Condiments | Seasoning, salt, ketchup, lime juice |
| Dairy | All types of milk, yoghurt, cheese, ice cream, dough, curd |
| Pickles | All types of vegetable pickles |
| Soy | All product of soybean |
| Anxiety | Depression | Stress | |||||||
|---|---|---|---|---|---|---|---|---|---|
| Yes (237) | No (197) | P-value | Yes (234) | No (200) | P-value | Yes (246) | No (188) | P-value | |
| Age (years) | 38.77 ± 9.60 | 38.32 ± 9.76 | 0.63 | 39.04 ± 9.63 | 38.01 ± 9.71 | 0.27 | 39.67 ± 9.55 | 37.12 ± 9.64 | 0.006 |
| Gender (%) Male Female |
60.1 49.6 |
39.9 50.4 |
0.02 | 58.7 49.6 |
41.3 50.4 |
0.05 | 63.5 50.4 |
36.5 49.6 |
0.006 |
| Marital status (%) Married with partner Never married Widowed/divorced/separated |
55.5 53.4 47.8 |
44.5 46.6 52.2 |
0.74 | 57.3 49.6 34.8 |
42.7 50.4) 65.2 |
0.06 | 60.9 49.6 43.5 |
39.1 50.4 56.6 |
0.04 |
| Education level (%) Less than 11th grade High school graduate College graduate or above |
11.1 35.3 56.3 |
88.9 64.7 43.7 |
0.007 | 22.2 47.1 54.8 |
77.8 52.9 45.2 |
0.12 | 11.1 58.8 57.5 |
88.9 41.2 42.5 |
0.02 |
| Employment (%) Employed Unemployed |
59.2 39.4 |
40.8 60.6 |
0.001 | 56.4 45.5 |
43.6 54.5 |
0.05 | 60.7 44.4 |
39.3 55.6 |
0.004 |
| Smoking (%) Yes No |
55.0 48.3 |
45.0 51.7 |
0.48 | 55.3 34.5 |
44.7 65.5 |
0.03 | 58.4 37.9 |
41.6 62.1 |
0.03 |
| Physically active (%) Low Moderate High |
51.1 59.9 56.2 |
48.9 40.1 43.8 |
0.27 | 52.7 56.5 53.9 |
47.3 43.5 46.1 |
0.79 | 53.3 59.9 57.3 |
46.7 40.1 42.7 |
0.47 |
| Weight (kg) | 76.78±14.04 | 75.26±15.96 | 0.30 | 76.30±13.93 | 75.86±6.04 | 0.76 | 77.06±14.04 | 74.80±16.02 | 0.12 |
| Height (cm) | 168.11±9.10 | 166.46±9.65 | 0.07 | 167.89±9.05 | 166.78±9.72 | 0.22 | 168.00±9.00 | 166.53±9.80 | 0.11 |
| Waist circumference (cm) | 92.51±12.12 | 92.59±13.85 | 0.95 | 92.55±12.94 | 92.55±12.88 | 0.99 | 92.80±12.19 | 92.21±13.83 | 0.65 |
| Hip circumference (cm) | 105.05±7.51 | 105.29±9.49 | 0.77 | 104.79±8.07 | 105.58±8.84 | 0.34 | 104.85±7.71 | 105.57±9.34 | 0.39 |
| WHR | 0.88 ± 0.08 | 0.88 ± 0.09 | 0.51 | 0.88 ± 0.09 | 0.88 ± 0.08 | 0.41 | 0.88 ± 0.08 | 0.87 ± 0.09 | 0.16 |
| WHtR | 0.55 ± 0.07 | 0.56 ± 0.08 | 0.87 | 0.55 ± 0.08 | 0.56 ± 0.07 | 0.76 | 0.55 ± 0.07 | 0.55 ± 0.08 | 0.98 |
| BMI (kg/m2) | 27.16±4.47 | 27.05±4.79 | 0.82 | 27.07±4.55 | 27.16±4.69 | 0.85 | 27.27±4.37 | 26.89±4.92 | 0.41 |